Submit data
Cite
Yat-tsai Richie Wan, Morten Nielsen ; Placeholder
Read the full article here
Instructions for TCRcluster-1.0
Input format
- The data should have format: A1,A2,A3,B1,B2,B3,label, or A1,A2,A3,B1,B2,B3.
- Each CDR chain have a different maximum length limit, with the standard uppercase 20 amino acid alphabet:
A C D E F G H I K L M N P Q R S T V W Y
- The input needs to be comma separated, with headers: A1,A2,A3,B1,B2,B3
- The input can be submitted with or without labels. Labels can be any specificity to a known peptide or the source of a sample, and are not used during clustering.
- If labels are provided, the column header must be A1,A2,A3,B1,B2,B3,label
- Additional columns that will not be used by the program (for example indices, etc.) can be added, but only columns with the column names A1,A2,A3,B1,B2,B3 are required.
- Load Example data on the Submission page to ensure your data format is correct.
List of supported CDR lengths
- Paste the data into the box, or load an example file, or load a file from your local machine.
- Select which VAE model to use.
- Select whether to run the clustering optimisation (recommended), or provide a custom distance threshold.
Click the submit button when all data are entered.
EXAMPLE OUTPUT
Using the sample data, with labels, with optimisation:
Click here to download the latent vector and predicted clusters in .csv format.
Click here to download the clusters summary in .csv format.
Click here to download the cosine distance matrix in .csv format.
Click here to download the optimisation results in .csv format.
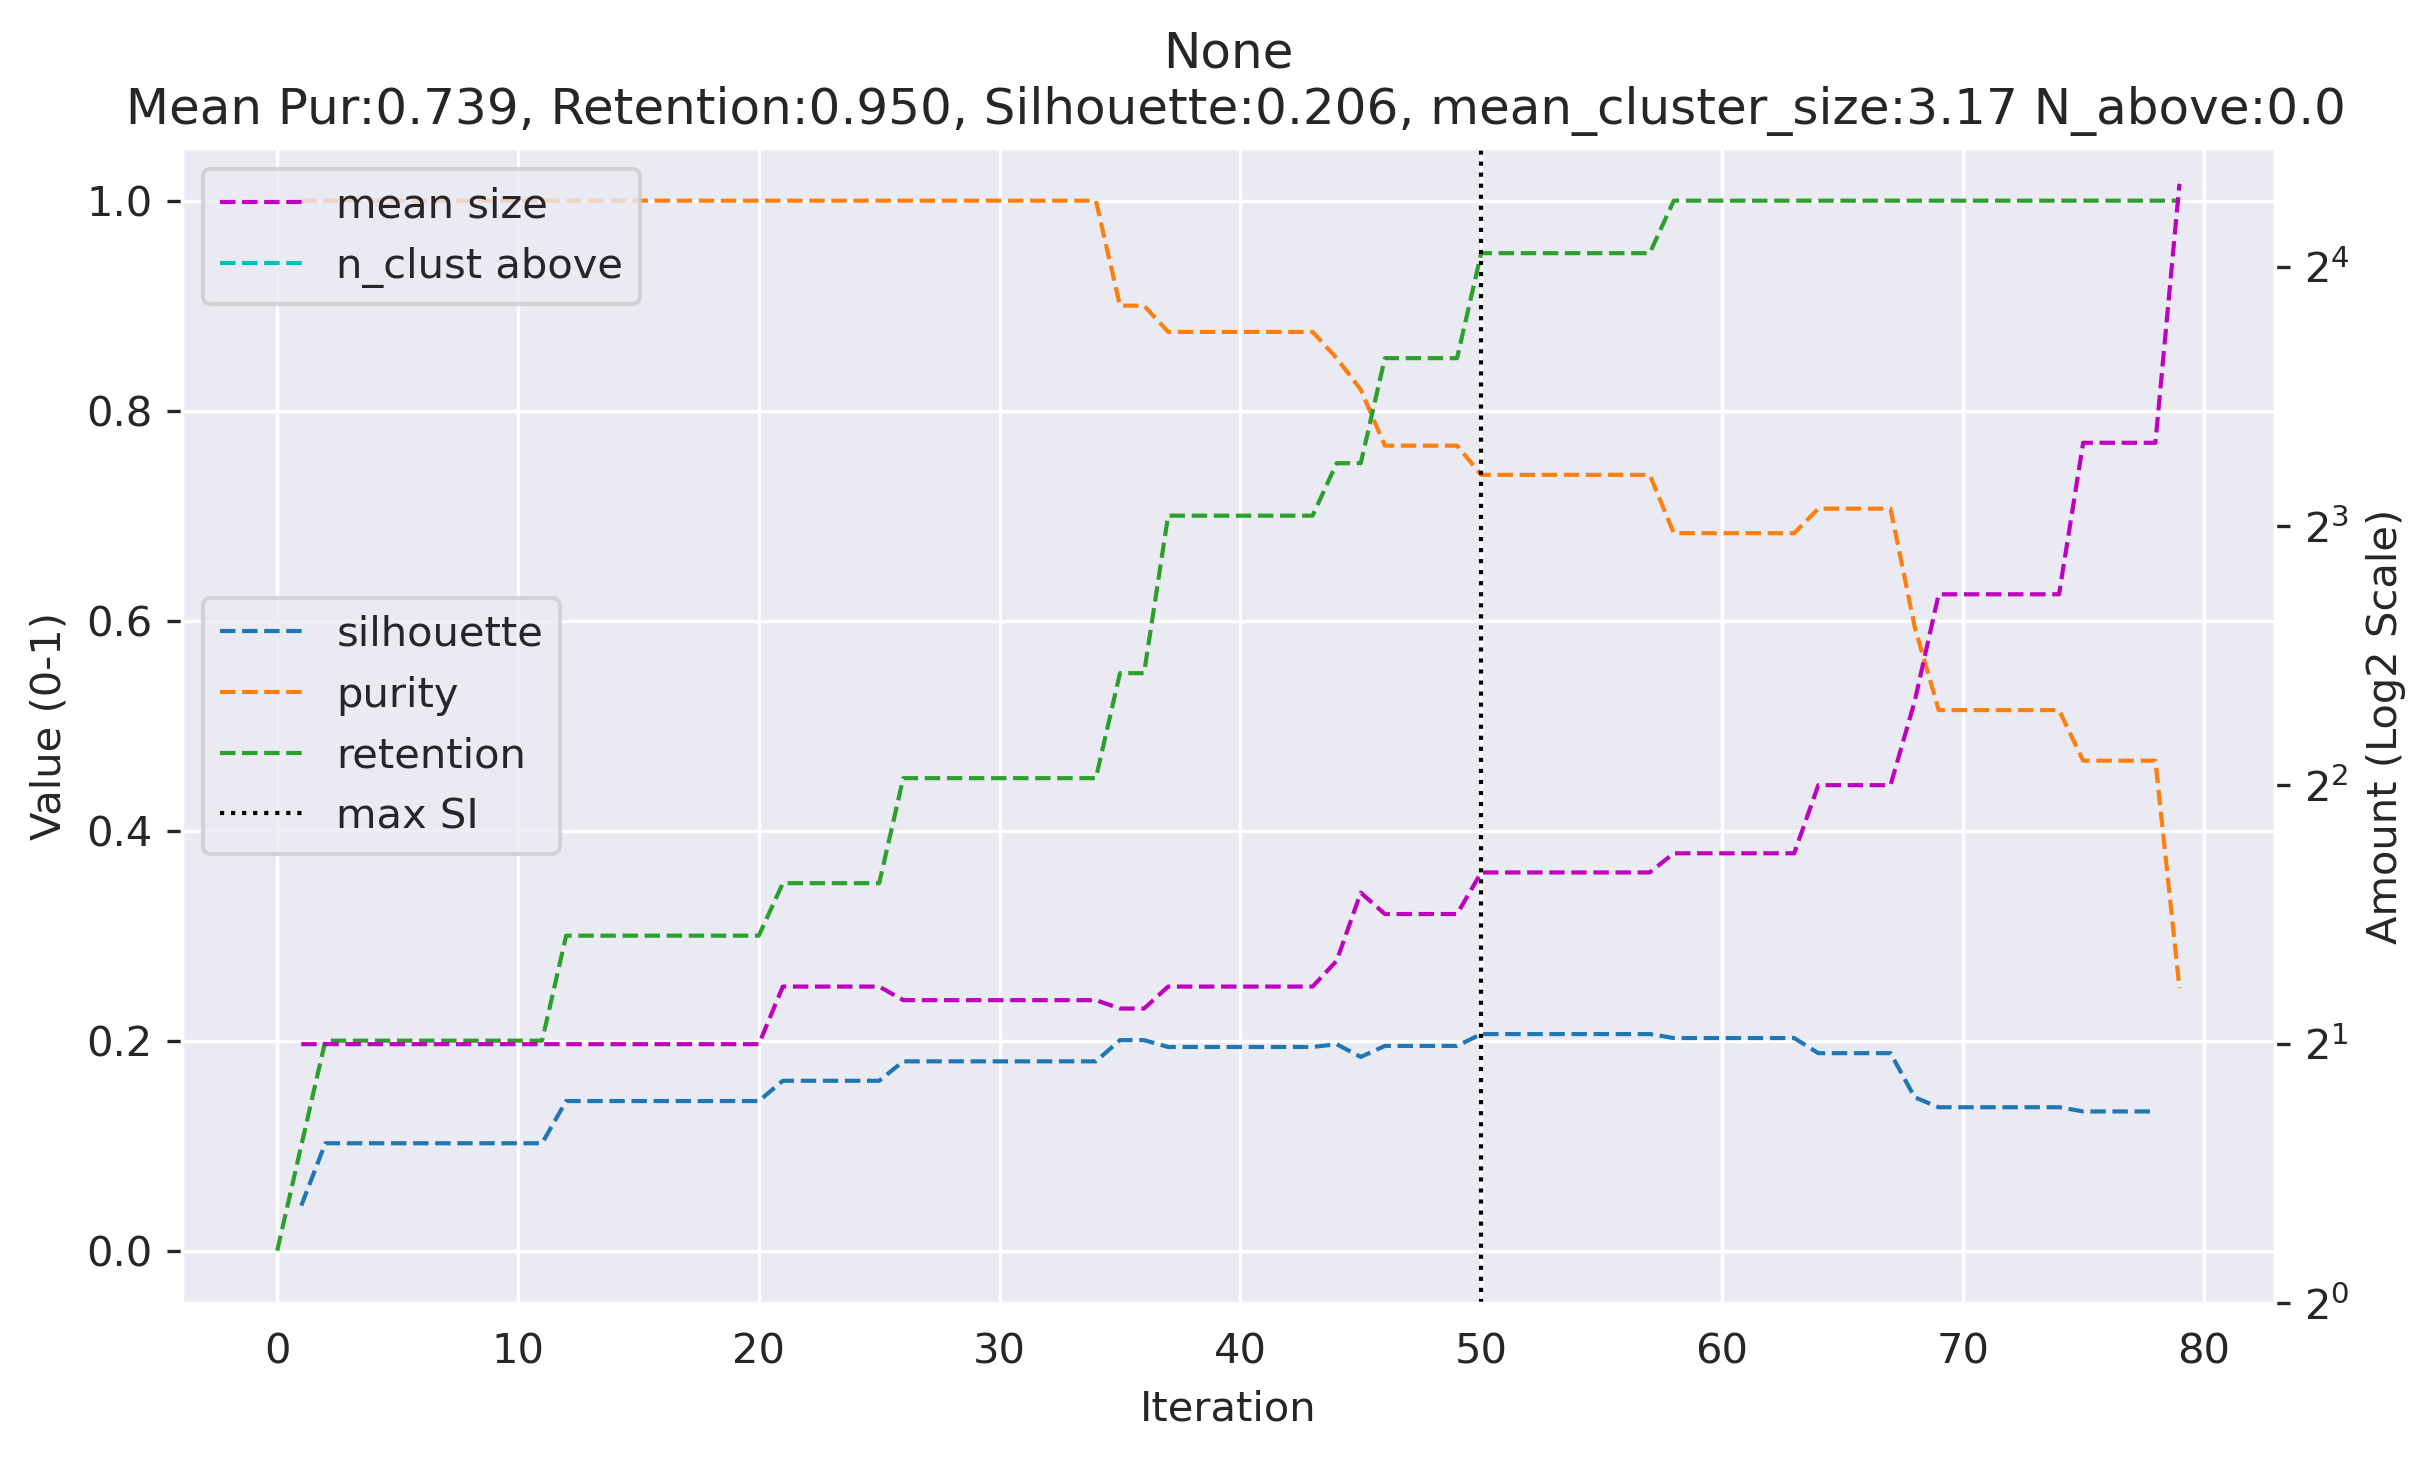
Click here to download the optimisation curve plot in .png format.
Below is a table preview of clustering metrics at each threshold tested.
A total of 80 points are tested, showing only 10 points centered around the best solution.
the 'best' column denotes the best silhouette solution.
threshold best n_cluster n_singletons silhouette mean_purity \
40 0.77949 False 6 6 0.194 0.875
41 0.79165 False 6 6 0.194 0.875
42 0.80380 False 6 6 0.194 0.875
43 0.81596 False 6 6 0.194 0.875
44 0.82811 False 6 5 0.197 0.850
45 0.84026 False 5 5 0.184 0.820
46 0.85242 False 6 3 0.195 0.767
47 0.86457 False 6 3 0.195 0.767
48 0.87673 False 6 3 0.195 0.767
49 0.88888 False 6 3 0.195 0.767
50 0.90104 True 6 1 0.206 0.739
51 0.91319 False 6 1 0.206 0.739
52 0.92534 False 6 1 0.206 0.739
53 0.93750 False 6 1 0.206 0.739
54 0.94965 False 6 1 0.206 0.739
55 0.96181 False 6 1 0.206 0.739
56 0.97396 False 6 1 0.206 0.739
57 0.98612 False 6 1 0.206 0.739
58 0.99827 False 6 0 0.202 0.683
59 1.01042 False 6 0 0.202 0.683
60 1.02258 False 6 0 0.202 0.683
retention mean_size max_size
40 0.70 2.333 4.0
41 0.70 2.333 4.0
42 0.70 2.333 4.0
43 0.70 2.333 4.0
44 0.75 2.500 5.0
45 0.75 3.000 5.0
46 0.85 2.833 5.0
47 0.85 2.833 5.0
48 0.85 2.833 5.0
49 0.85 2.833 5.0
50 0.95 3.167 5.0
51 0.95 3.167 5.0
52 0.95 3.167 5.0
53 0.95 3.167 5.0
54 0.95 3.167 5.0
55 0.95 3.167 5.0
56 0.95 3.167 5.0
57 0.95 3.167 5.0
58 1.00 3.333 5.0
59 1.00 3.333 5.0
60 1.00 3.333 5.0
DESCRIPTION
The output contains up to 5 files when optimising, or 3 files when using a custom threshold:
latent vector and predicted cluster CSV table containing the input datapoint and sequences, extracted latent vector (columns z_XX) and the predicted cluster label.
clusters summary CSV table containing a summary of the clusters for each label. Purity and majority labels are only informative if labels were provided with the input data.
cosine distance matrix CSV table of square cosine distance matrix (all versus all). Additional placeholder label and index columns are included and only used in the python code for compatibility purposes.
Optimisation results CSV table containing the clustering metrics at each hyperparameter (distance threshold) used in the optimisation process. The column "Best" denotes which threshold has been found to be optimal (e.g. max Silhouette score).
Optimisation plot png plot of the optimisation table, with the optimal SI denoted by a dashed line.
Silhouette score, purity, retention are plotted in range (0-1) on the main Y-axis. mean size and n_cluster above are plotted in log2 scale on the secondary Y-axis. n_above denotes the number of clusters above size 6 and purity 80% (only useful if labels were provided)
References
-
Yat-tsai Richie Wan, Morten Nielsen,
Manuscript in preparation, 2025, Vol. 1, No. 2, 1234-1235.
Abstract
T cells are a crucial part of the adaptive immune system, tasked with identifying and eliminating pathogen-infected or cancerous cells. However prediction of T cell specificity and clustering T cell repertoires remain a highly challenging task, mainly due to their large sequence diversity. As a means to resolve this, accurately encoding T-cell receptor (TCR) sequences into a latent feature space is critical for advancing TCR-specificity prediction and downstream applications. Here, we developed a variational autoencoder (VAE)-based model trained on paired TCR α-β chain data. Our approach incorporates all six complementarity-determining regions (CDRs) for enhanced specificity assessment. Optimized through a custom loss regime, our best models achieved up to 99.3% sequence reconstruction accuracy. We introduced a semi-supervised “Two-Stage VAE” framework, combining a cosine triplet loss with an integrated classifier predictor to refine the latent representations for peptide specificity. Benchmarking against sequence-based methods (TCRBase and tcrdist3), our VAE models demonstrated superior performance for peptide-specificity prediction. Clustering analyses leveraging our VAE latent space were evaluated using K-means, agglomerative clustering, and a novel graph-based Top1Cut method. Agglomerative clustering achieved the most biologically relevant results, balancing cluster purity and retention despite noise in TCR specificity annotations.
We extended these insights to TCR repertoire data, evaluating immune repertoires from SARS-CoV-2 and cancer patients. Across datasets, VAE-based models outperformed sequence-based methods, particularly in retention metrics, with notable improvements in the SARS-CoV-2 repertoire likely reflecting the presence of both SARS-CoV-2 epitopes and TCRs in training dataset. Moreover, the cancer repertoire analysis highlighted the generalizability of our approach, where the Two-Stage VAE without triplet loss excelled despite minimal similarity between the training and test data. Collectively, these results demonstrate the potential of VAE-based latent representations for TCR-specificity prediction, clustering, and repertoire analysis, offering a robust framework for analyzing diverse immune datasets.
Supplementary material
Here, you will find the data set used for training and evaluating TCRcluster-1.0.
TCRcluster-1.0
Training data
Used to train the VAE models
Only partitions 2,3,4 were used for training.
Partition 0 was used as the validation.
Partition 1 was used as the held-out test set.
All partitions, binders only (Used to train models)
All partitions, with swapped negatives (Used to train models)
Validation data
Only partition 0 was used for validation
17 peptides subset, test set binders only (used for model development)
17 peptides subset, with swapped negatives (used for model development)
Test data
Only partition 1 was used for testing, never seen in either training or validation
17 peptides subset, test set with swapped negatives (used for figure 2)
17 peptides subset, test set binders only (used for figure 3)
References
...
Submitted 2025.