Instructions
Prerequisites
Each sequence in the submitted alignment must have an end placed numerical value in the FASTA header, separated from the rest of the line with a blank space e.g.
>MySequence1 1.2
ARNDCQEGHILKMFPSTWYV
Scientific numbering will also be accepted, e.g.
>MySequence2 1e-3
ARNDCQEGHILKMFPSTWYV
There must be at least two sequence-variants submitted and at least two
different sequence associated values.
Submission
Please note that only the 20 standard amino acid residues (
ARNDCQEGHILKMFPSTWYV) will be considered, any other characters will simply be excluded from the evaluation. This also includes gaps, which are thusly neither evaluated.
The sequences can be input in the following two ways:
- Paste a number of sequences in FASTA format into the upper window of the main server page.
- Select a FASTA file on your local disk, either by typing the file name into the lower window or by browsing the disk.
Options
Modify the default settings to fit your preferences.
- Significance threshold
Choose a significance threshold beyond which you consider a residue as significantly distributed. α = 0.05 means that there is a 5% or less chance that the identified residue is in fact not significantly associated with the data set phenotype (Type I error, false positive)
- Method for correction for multiple testing
From the drop-down list you can choose among different methods for adjusting the computed p-values. You can also choose to not correct for multiple testing. Bonferroni single-step is more conservative than Holm step-down. Choosing 'no correction' increases the chance that the identified residue is in fact not significantly associated with the data set phenotype (Type I error, false positive). Briefly: A p-value of 0.05 obtained when performing 10 tests, has a Bonferroni single-step corrected p-value of: p-valuecorrected = min[1, p-valuenon-corrected x ntests] = min[1, 0.05 x 10] = 0.5
- Choose sorting of numerical values
Decreased sorting means that the highest value is considered the 'strongest' (e.g. quantitative detection via fluorescence), increased in turn means that the lowest value is considered as the 'strongest' (e.g. binding affinity)
- Sequence identifier for relative numbering
Enter the sequence identifier of a reference sequence into the text field. This sequence will be identified in the sequence set and all sequence positions in the heatmap and logo-output will be numbered relative to the reference sequence. If any gaps are present in the reference sequence, the gap positions will be numbered negatively, i.e. p-1 is the first gap, p-2 is the second and so on. Any non-gapped positions will be numbered sequentially p1, p2 ... pn
-
Type of logo
Full logo: Include ALL residues at ALL positions.
Significant positions: Include ALL residues at positions where at least ONE amino acid residue was identified as significantly associated with the data set phenotype.
Significant residues: Include ONLY residues identified as significantly associated with the data set phenotype.
Submit the job
Click on the
"Submit" button. The status of your job (either 'queued'
or 'running') will be displayed and constantly updated until it terminates and
the server output appears in the browser window.
At any time during the wait you may enter your e-mail address and simply leave
the window. Your job will continue; you will be notified by e-mail when it has
terminated. The e-mail message will contain the URL under which the results are
stored; they will remain on the server for 24 hours for you to collect them.
Sample data
Sample
data for test of server functionality is available. The data used is identical to that of the 'output format' tab.
To test the server, simply click the 'Load sample data' button and 'submit'.
Output format
Graphical output
The output examples displayed on this page, was obtained by going to the
SigniSite-2.1 server [1] and clicking 'Load sample data' followed by 'Submit' under the
SigniSite logo.
This will generate the following figures
Figure 1: Sequence logo quantifying strength of residue association
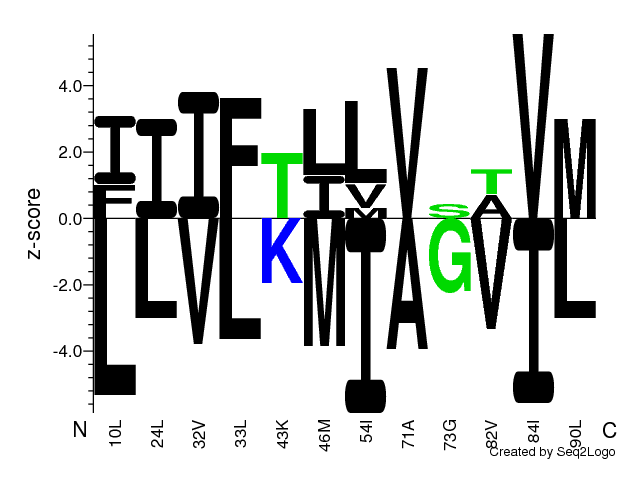
Logo quantifying strength of residue association [2].
Amino acid residues on the positive y-axis are associated with strong phenotype values
and residues on the negative y-axis, with weak phenotype values, i.e. residues above the
z=0.0 line have a z-score larger than zero and are thus predominantly found among the top
of the sorted aligned sequences. E.g. low binding affinities or high luminescence signals
delending on the users choice of sequence sorting. Vice versa for residues below the
z=0.0 line.
The amino acids are colored according to their chemical properties as follows:
Acidic [DE]: red, Basic [HKR]: blue, Hydrophobic [ACFILMPVW]: black and Neutral
[GNQSTY]: green. [3]. If any of the sites are denoted by negative numbers, this
implies that a reference sequence was chosen and these sites lie in gapped regions.
Gapped regions are regions, in which insertion (ins) is found. Please note that if
a reference sequence was chosen, this sequence will be given below each column in
the logo plot, rather than the consensus sequence.
-1 is the first ins, -2 the second ins and so on.
Figure 2: Heatmap visualisation of strength of residue association
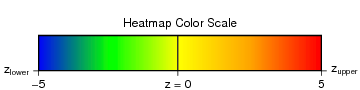
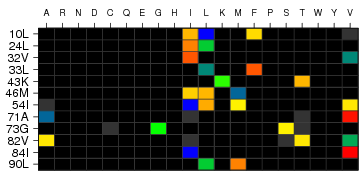
Heatmap visualisation of strength of residue association. The color-scale
(See 'Heatmap Color Scale') ranges from blue z < -5 to red z >5.
For z-scores larger than -5, but smaller than 5 colors inbetween are
used. Black cells denote abscence of amino acid residue. A grey cell denotes a residue
with a
z-score of
0. If there is only one grey cell at a position, the position
is completely conserved harbouring only this residue. If more than one grey cell are
present, the
p-value for this residue has become
p = 1 after correction for
multiple comparisons. Each column corresponds to one of the 20 proteinogenic amino acids
and each row to a position in the submitted multiple sequence alignment. If any of the sites
are denoted by negative numbers, this implies that a reference sequence was chosen and these
sites lie in gapped regions. Please note that if a reference sequence was chosen, this
sequence will be given below each column in the logo plot, rather than the consensus sequence.
Gapped regions are regions, in which an insertion (ins) is found. -1 is the first ins, -2 the
second ins and so on.
Additional output
Other than the graphical output, the following output files will be available:
- Alignment
- - The multiple sequence alignment used for the analysis
- Excel file 1 (.csv with blanks)
- - Excel compatible z-score table. All non-present residues are blank
- Excel file 2 (.csv with zeros)
- - Excel compatible z-score table. All non-present residues are '0.000'
- HTML score table
- - Printer friendly z-score table in HTML format.
- Weight matrix/PSSM
- - Position Specific Scoring Matrix (PSSM)
- Rank list of z-scores
- - Ranked list of z-scores. Columns are:
- #Pos: The position in the submitted multiple sequence alignment
- Cons: The consensus residue at the position
- Resi: The amino acid residue for which the z-score was computed
- Asso: Positive or negative association of z-scores (denotes z<0 or z>0)
- Zsco: The absolute value of the computed z-score (i.e. 'ignoring' the sign of z)
- Pval: The p-value corresponding to the computed z-score
- Rank: The rank of the z-score (Tied values are assigned mean rank)
References
For publication of results, please cite [1]
-
Jessen LE, Hoof I, Lund O, Nielsen M.
SigniSite: Identification of residue-level genotype-phenotype correlations in protein multiple sequence alignments.
Nucleic Acids Res. 2013 Jul;41(Web Server issue):W286-91. doi: 10.1093/nar/gkt497. Epub 2013 Jun 12.
-
Thomsen MC, Nielsen M.
Seq2Logo: a method for construction and visualization of amino acid binding motifs and sequence profiles including sequence weighting, pseudo counts and two-sided representation of amino acid enrichment and depletion.
Nucleic Acids Res. 2012 Jul;40(Web Server issue):W281-7. doi: 10.1093/nar/gks469. Epub 2012 May 25.
-
Lund, O., Nielsen, M., Lundegaard, C., Kesmir, C., Brunak, S.
Immunological Bioinformatics.
(S. Istrail, P. Pevzner, M. Waterman, Eds.), (1st ed., p. 312). Cambridge, Massachusetts, London, England: The MIT Press. ISBN-10: 0262122804, ISBN-13: 9780262122801. Jul 2005
Article abstract
Identifying which mutation(s) within a given genotype is responsible for an observable phenotype is important in many aspects of molecular biology. Here, we present SigniSite, an online application for subgroup-free residue-level genotype–phenotype correlation. In contrast to similar methods, SigniSite does not require any pre-definition of subgroups or binary classification. Input is a set of protein sequences where each sequence has an associated real number, quantifying a given phenotype. SigniSite will then identify which amino acid residues are significantly associated with the data set phenotype. As output, SigniSite displays a sequence logo, depicting the strength of the phenotype association of each residue and a heat-map identifying ‘hot’ or ‘cold’ regions. SigniSite was benchmarked against SPEER, a state-of-the-art method for the prediction of specificity determining positions (SDP) using a set of human immunodeficiency virus protease-inhibitor genotype–phenotype data and corresponding resistance mutation scores from the Stanford University HIV Drug Resistance Database, and a data set of protein families with experimentally annotated SDPs. For both data sets, SigniSite was found to outperform SPEER.
REFERENCE
For publication of results, please cite:
SigniSite: Identification of residue-level genotype-phenotype correlations in protein multiple sequence alignments
Leon Eyrich Jessen, Ilka Hoof, Ole Lund, and Morten Nielsen
Nucl. Acids Res. first published online June 12, 2013 doi:10.1093/nar/gkt497
Abstract or
Open Access Full Text (PDF)