In the SignalP 4.0 article, we show that SignalP 4.0 is superior in performance to SignalP 3.0 and ten competing methods (five dedicated signal peptide predictors and five transmembrane topology predictors with built-in signal peptide models), when the performance is measured by Matthews Correlation Coefficient (MCC).
Matthews Correlation Coefficient is a very widely used measure for performance in bioinformatics. It is defined thus:
In Table E (pp. 10-11) of the supplementary materials you can see the MCC values for SignalP and the competing methods.
However, SignalP 4.0 is not superior to SignalP 3.0 according to all performance measures. Notably, the sensitivity is lower when you use the default cutoff. Sensitivity is the proportion of the true signal peptides that are correctly predicted:
All prediction methods that make a classification from a numerical output have a choice to make: where to place the cutoff (also known as threshold) for the output? If you use a high cutoff, you will get few false positives, but also a low sensitivity; if you lower the cutoff, you will get a better sensitivity at the price of more false positives. The false positive rate is defined as:
There is no single correct answer to the problem of choosing the cutoff, it depends on the contet in which the prediction method is used. For SignalP, we have used a cutoff on the D-score (see the Output format for a definition) that maximizes the MCC.
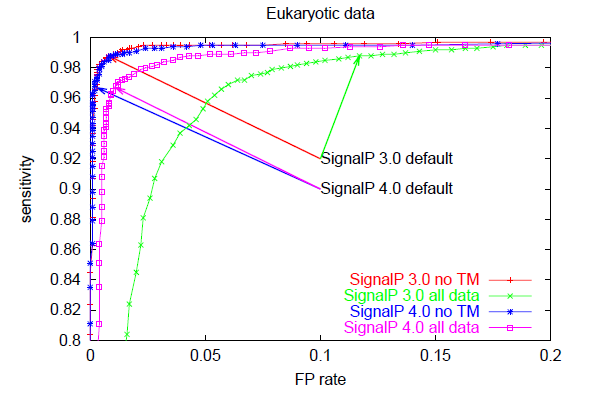
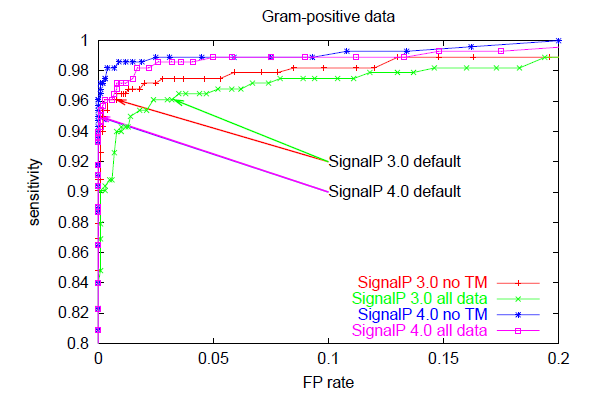
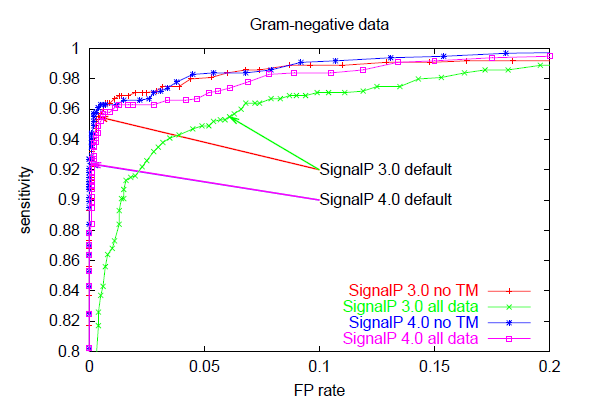
The trade-off between sensitivity and false positive rate is often illustrated graphically as a so-called ROC curve which has false positive rate on the x-axis and sensitivity on the y-axis for varying values of the cutoff. The better a predition method is, the closer to the upper left corner the ROC curve will be, while a random (non-informative) prediction will follow the diagonal. This is an excellent way to compare different predictors, since it is not dependent on cutoff choice.
Below, you can see ROC curves for SignalP 3 and 4 for the three different organism groups. Note: in contrast to the values in Table E, these are not evaluation performances; they are made by applying the finished methods to the Total data set before homology reduction.
These ROC curves show that:
SignalP 4.1 offers the users an option of using cutoff values which reproduce the sensitivity of SignalP 3.0. The price is, of course, a slightly higher false positive rate.
In the table below, the performace values are shown for SignalP 3.0, SignalP 4.1 with default cutoff, and SignalP 4.1 with "sensitive" (SignalP-3.0 compliant) cutoff. Note, again, that these are not evaluation performances and should not be used to compare SignalP to competing methods, they are merely for the purpose of comparing SignalP versions.
| Method | Cutoff, SignalP-noTM | Cutoff, SignalP-TM | Sensitivity | FP rate, no TM | FP rate, all data | MCC, no TM | MCC, all data |
|---|---|---|---|---|---|---|---|
| Eukaryotic data | |||||||
| SignalP 3.0 | 0.43 | 0.988 | 0.008 | 0.117 | 0.978 | 0.781 | |
| SignalP 4.1 default | 0.45 | 0.50 | 0.967 | 0.003 | 0.011 | 0.972 | 0.955 |
| SignalP 4.1 sensitive | 0.34 | 0.34 | 0.988 | 0.009 | 0.043 | 0.976 | 0.903 |
| Gram-positive data | |||||||
| SignalP 3.0 | 0.45 | 0.961 | 0.008 | 0.033 | 0.937 | 0.814 | |
| SignalP 4.1 default | 0.57 | 0.45 | 0.950 | 0.000 | 0.001 | 0.973 | 0.967 |
| SignalP 4.1 sensitive | 0.42 | 0.42 | 0.961 | 0.000 | 0.003 | 0.978 | 0.958 |
| Gram-negative data | |||||||
| SignalP 3.0 | 0.44 | 0.955 | 0.004 | 0.061 | 0.949 | 0.691 | |
| SignalP 4.1 default | 0.57 | 0.51 | 0.924 | 0.000 | 0.001 | 0.957 | 0.949 |
| SignalP 4.1 sensitive | 0.42 | 0.42 | 0.955 | 0.002 | 0.006 | 0.963 | 0.937 |