CITATIONS
For publication of results, please cite:
SignalP 4.0: discriminating signal peptides from transmembrane regions
Thomas Nordahl Petersen, Søren Brunak, Gunnar von Heijne & Henrik Nielsen
Nature Methods, 8:785-786, 2011
doi: 10.1038/nmeth.1701
PMID: 21959131
Supplementary materials:
nmeth.1701-S1.pdf
Other relevant papers:
- Original paper (version 1.0):
Identification of prokaryotic and eukaryotic signal peptides
and prediction of their cleavage sites.
Henrik Nielsen, Jacob Engelbrecht, Søren Brunak
and Gunnar von Heijne.
Protein Engineering, 10:1-6, 1997.
- SignalP-HMM (version 2.0):
Prediction of signal peptides and signal anchors by a hidden
Markov model.
Henrik Nielsen and Anders Krogh.
Proceedings of the Sixth International Conference on Intelligent
Systems for Molecular Biology (ISMB 6),
AAAI Press, Menlo Park, California, pp. 122-130, 1998.
- Version 3.0:
Improved prediction of signal peptides: SignalP 3.0.
Jannick Dyrløv Bendtsen, Henrik Nielsen,
Gunnar von Heijne and Søren Brunak.
J. Mol. Biol., 340:783-795, 2004.
Download the full article in PDF.
- Paper about using SignalP and other
protein subcellular localization prediction methods:
Locating proteins in the cell using TargetP,
SignalP, and related tools
Olof Emanuelsson, Søren Brunak, Gunnar von Heijne, Henrik Nielsen
Nature Protocols 2:953-971 (2007).
Access the
paper and supplementary materials.
Frequently Asked Questions
Changes from version 4.0 to 4.1
Changes from version 3 to 4
Biological background, signal peptides
Biological background, other sorting signals
Biological background, organism groups
History
— What's new?
Please see the Version history.
— Why do you present a choice between two cutoff settings?
Can't you just decide on one?
The optimal cutoff really depends on what you want to use the method
for. If it is important to find all signal peptides, use the sensitive
cutoff. If you want an estimate of the number of signal peptides in a
genome, use the default cutoff.
— Why have you imposed a minimum length?
Because we believe that predictions of signal peptides
shorter than ten residues made by SignalP 4.1 are false. The shortest
known signal peptides are 11 residues long (with one exception,
SP23_TENMO,
which does not look like a signal peptide at
all). Click
here for an updated list of experimentally confirmed signal
peptides from UniProt of length 11 or shorter.
— What happened to the Background page?
It's here! The important material from the Background page has been
integrated into this FAQ, we hope you like the new format.
— What's new?
Please see the Version history.
— What happened to the HMM part?
While making SignalP 4.0, we did retrain the Hidden Markov Model (HMM)
part of SignalP. However, we found that it did not perform better than
the neural networks in any of the performance parameters we tested.
Therefore, we decided not to include it. If the HMM output is important
for you, you can still use
SignalP 3.0.
— Why is my favourite signal peptide no longer predicted correctly?
SignalP 3.0 could do it!
As explained on the Performance page,
SignalP 4 with the default cutoff has a lower sensitivity than SignalP
3. Please try again with the new "Sensitive" setting.
— What happened to the Yes/No answers for max C score etc.?
SignalP 3.0 provided five Yes/No answers for the NN part. We found that
this was confusing for users and obscured the fact that the D-score is
the best score for discriminating between signal peptides and non-signal
peptides.
— What are signal peptides?
The term "signal peptide" is used with two meanings: In the broad
sense (used in many textbooks),
a signal peptide is any sorting signal embedded in the amino
acid sequence of a protein. In the narrow sense (used in most of
the scientific literature), a signal peptide
is an N-terminal signal that directs the protein across the ER
membrane in eukaryotes and across the plasma membrane in prokaryotes.
Signal peptides in the narrow sense are also known as ER signal
peptides or secretory signal peptides. Read more in
UniProt, in
Wikipedia,
and in the
Sequence feature ontology.
It is important to emphasize that SignalP predicts signal peptides in
the narrow sense only.
— Are signal peptides always N-terminal?
In the narrow sense: Yes, per definition. In the broad sense: No,
there are several sorting signal that are C-terminal
(e.g. the PTS1 signal for peroxisomal import)
or internal (e.g. the nuclear localization signal).
— Are signal peptides (in the narrow sense) always cleaved?
No, there are rare cases of uncleaved signal peptides. For an updated
list of such proteins annotated in UniProt, click
here.
These should not be confused with signal anchors, see below.
In SignalP, these typically get high S-scores but low C- and Y-scores.
— Which protease is responsible for signal peptide
cleavage?
In bacteria, it is Signal Peptidase I (SPase I), also known as Leader Peptidase
(
Lep). In eukaryotes, it is the signal peptidase complex (SPC), which
consists of four subunits in yeast and five in mammals.
Read more in
MEROPS.
— My protein has a signal peptide. Can I then safely
conclude that it is secreted?
No. You can only conclude that it enters the secretory pathway.
In eukaryotes, there are several opportunities for a protein with a
signal peptide to escape secretion. It could:
- It could be retained in the endoplasmic reticulum (ER). Soluble ER-resident
proteins have a C-terminal retention signal with the consensus
sequence KDEL, see
PROSITE.
- be retained in the Golgi apparatus,
- be directed to the lysosome (vacuole in plants and fungi),
- have one or more transmembrane helices and therefore be
retained in either the plasma membrane, or one of the membranes of the
secretory pathway (ER, Golgi, lysosome/vacuole), or
- have a signal for GPI-anchoring, a C-terminal cleaved
peptide which functions as a signal for attachment of a
Glycophosphatidylinositol
(GPI) group that anchors the protein to the
outer face of the plasma membrane.
In
Gram-positive bacteria, a protein with a signal peptide could:
- have one or more transmembrane helices, or
- be attached to the cell wall.
In Gram-negative bacteria, a protein with a signal peptide could:
- have one or more transmembrane helices,
- be retained in the periplasm, or
- be inserted into the outer membrane as a β-barrel transmembrane
protein.
— Does SignalP predict signal peptides of bacterial lipoproteins?
No. Bacterial lipoproteins have special signal peptides which are
cleaved by Signal Peptidase II (SPase II), also known as Lipoprotein
signal peptidase (
Lsp). A diacylglyceryl group is attached to a Cysteine residue
in position +1 relative to the cleavage site, which bears no resemblance
to the SPase I cleavage site. See also
MEROPS
and
PROSITE.
For prediction of prokaryotic lipoproteins we recommend using the
LipoP server.
— Does SignalP predict TAT (Twin-arginine translocation) signal peptides?
Not very well. Bacterial TAT signal peptides, which direct their proteins through
an alternative translocon (
TatABC), have a special motif containing two
Arginines in the n-region. Additionally, they are in general longer and less
hydrophobic than normal (
Sec) signal peptides. As a consequence,
they are sometimes missed by SignalP, even though they are cleaved by SPase
I (
Lep). See also
PROSITE and
InterPro.
For prediction of TAT signal peptides we recommend using the
TatP server.
— What are signal anchors?
A signal anchor is a transmembrane helix located close to the N-terminus
of a protein with an N-in orientation (i.e. the N-terminus is on the
cytoplasmic side of the membrane). It functions much like a signal
peptide since it is recognized by the Signal Recognition Particle (SRP)
and inserted into the translocon; but instead of being cleaved and
degraded it remains in the membrane and anchors the protein to it.
Proteins anchored in this way are known as Type II transmembrane
proteins.
 |
Signal peptides (above) versus
signal anchors (below) |
It is important to realize that the difference between signal peptides
and signal anchors is not a question of presence or absence of a
cleavage site. Instead, the most important difference seems to be the
length of the hydrophobic domain. It has been shown experimentally that
it is possible to convert a cleaved
signal peptide to a signal anchor merely by lengthening the
h-region, without altering the cleavage site
(
Chou & Kendall 1990;
Nilsson, Whitley, & von Heijne 1994).
The introduction of the Hidden Markov Model (HMM) method in SignalP
version 2 made it possible to some extent to distinguish signal peptides
from signal anchors (in that version, only in eukaryotes). However,
SignalP 4 (based entirely on the Neural Network (NN) method), does a
better job, since its negative set is not confined only to transmembrane
helices annotated as signal anchors, but includes all types of
transmembrane segments close to the N-terminus.
— What should I use for predicting signal peptides in the
broad sense?
For mitochondrial and plastid import signals, also known as
transit
peptides, we recommend
TargetP. For other
sorting signals, we refer to our paper
"
Locating
proteins in the cell using TargetP, SignalP, and related
tools".
— What should I use for predicting non-classical
(leaderless) secreted proteins?
Not all secretory proteins carry signal peptides. Some proteins enter a non-classical secretory pathway
without any currently known sequence motif. In eukaryotes, these proteins are mostly growth factors
and extracellular matrix binding proteins. In Gram-negative bacteria, the
type I, III, IV and VI secretion systems function without signal peptides.
For prediction of such proteins we
recommend the
SecretomeP
server.
— Why is there no version for Archaea?
Because there are too few experimentally confirmed signal
peptides from this organism group in the
UniProt database (click
here for an updated list).
— Which version should I use for vira and bacteriophages?
You should use the version corresponding to the host organism. There are
some indications that viral signal peptides differ from those of the
host organism, but SignalP currently does not take that into account.
— Which version should I use for Tenericutes/Mollicutes
(Mycoplasma and related genera)?
You shouldn't use SignalP at all for these organisms, since they seem to
lack a type I signal peptidase completely!
— Which version should I use for metagenomic sequences
of unknown origin?
This is an unsolved question. Please use all three versions to
search for signal peptides in such data.
— Is one version enough for all eukaryotic organisms, or
are there differences within the eukaryotes?
It is known that some yeast signal peptides are not recognized by
mammalian cells (Bird
et al.,
1987 and
1990).
Therefore, it would be natural to assume that separate SignalP versions
for yeast and Mammalia would provide better predictions than a common
eukaryotic version. While developing SignalP 4.0 we tried dividing the
eukaryotic data into animals, fungi, and plants and training separate
methods for these three groups. However, this did not give any
improvement, and performance for all three groups was better when using
the method trained on all eukaryotic sequences together.
— Are two versions enough for all bacteria, or
are there differences within the Gram-positive/Gram-negative
bacterial groups?
The Gram-negative version of SignalP is almost certainly biased towards
E. coli and other
γ-proteobacteria,
since these constitute the bulk
of the experimentally annotated bacterial proteins in UniProt.
Unpublished results suggest that some bacteria have very divergent
cleavage site motifs. Future versions of SignalP might therefore divide
the Gram-negative bacteria into several classes, if data are available.
Gram-positive bacteria probably constitute a more homogenous group, but
it is an open question whether there are differences in signal peptides
between
Actinobacteria (high G+C Gram-positive bacteria) and
Firmicutes (low G+C Gram-positive bacteria). More data on
Actinobacteria are needed before that can be answered.
— How are the various versions of SignalP related?
Please see the Version history.
— Was there ever a Nobel prize awarded for signal peptides?
Yes, for signal peptides in the broad sense. The importance of signal peptides
was emphasized in 1999 when Günter Blobel received the Nobel Prize in
physiology or medicine for his discovery "proteins have intrinsic
signal that govern their transport and localization in the cell".
The press release can be read
here.
— Was SignalP the first signal peptide predictor?
No, but it was, to our knowledge, the first to be implemented as a
web server (in 1996). Among the earlier methods were
McGeoch (1985)
and
von Heijne (1986),
both of which have been included in
PSORT.
— How many times have the SignalP papers been cited?
This information is available on Henrik Nielsen's
ResearcherID,
Scopus,
and
Google
Scholar pages.
References
Main references:
Other publications
Henrik Nielsen's PhD thesis
Original method (SignalP v. 1.1)
Identification of prokaryotic and eukaryotic signal peptides
and prediction of their cleavage sites.
Henrik Nielsen, Jacob Engelbrecht, Søren Brunak and Gunnar von
Heijne.
Protein Engineering,
10:1-6 (1997).
We have developed a new method for the identification of signal peptides and
their cleavage sites based on neural networks trained on separate sets of
prokaryotic and eukaryotic sequence. The method performs significantly better
than previous prediction schemes and can easily be applied on genome-wide data
sets. Discrimination between cleaved signal peptides and uncleaved N-terminal
signal-anchor sequences is also possible, though with lower precision.
Predictions can be made on a publicly available WWW server.
PMID: 9051728
(free full text pdf
version)
Update to SignalP v. 2.0
Prediction of signal peptides and signal anchors by a hidden Markov
model.
Henrik Nielsen and Anders Krogh.
Proc Int Conf Intell Syst Mol Biol. (ISMB 6),
6:122-130 (1998).
A hidden Markov model of signal peptides has been developed. It contains
submodels for the N-terminal part, the hydrophobic region, and the region
around the cleavage site. For known signal peptides, the model can be used to
assign objective boundaries between these three regions. Applied to our data,
the length distributions for the three regions are significantly different from
expectations. For instance, the assigned hydrophobic region is between 8 and 12
residues long in almost all eukaryotic signal peptides. This analysis also
makes obvious the difference between eukaryotes, Gram-positive bacteria, and
Gram-negative bacteria. The model can be used to predict the location of the
cleavage site, which it finds correctly in nearly 70% of signal peptides in a
cross-validated test — almost the same accuracy as the best previous method. One
of the problems for existing prediction methods is the poor discrimination
between signal peptides and uncleaved signal anchors, but this is substantially
improved by the hidden Markov model when expanding it with a very simple signal
anchor model.
PMID: 9783217
Update to SignalP v. 3.0
Improved prediction of signal peptides: SignalP 3.0.
Jannick Dyrløv Bendtsen, Henrik Nielsen,
Gunnar von Heijne and Søren Brunak.
J. Mol. Biol.,
340:783-795 (2004).
We describe improvements of the currently most
popular method for prediction of classically secreted proteins,
SignalP. SignalP consists of two different predictors based on
neural network and hidden Markov model algorithms, and both
components have been updated. Motivated by the idea that the
cleavage site position and the amino acid composition of the
signal peptide are correlated, new features have been included as
input to the neural network. This addition, together with a
thorough error-correction of a new data set, have improved the
performance of the predictor significantly over SignalP version 2.
In version 3, correctness of the cleavage site predictions have
increased notably for all three organism groups, eukaryotes, Gram
negative and Gram positive bacteria. The accuracy of cleavage site
prediction has increased in the range from 6–17 % over the
previous version, whereas the signal peptide discrimination
improvement mainly is due to the elimination of false positive
predictions, as well as the introduction of a new discrimination
score for the neural network. The new method has also been
benchmarked against other available methods.
PMID: 15223320
doi: 10.1016/j.jmb.2004.05.028
Update to SignalP v. 4.0
SignalP 4.0: discriminating signal peptides from transmembrane regions.
Thomas Nordahl Petersen, Søren Brunak,
Gunnar von Heijne and Henrik Nielsen.
Nature Methods,
8:785-786 (2011).
This is a Correspondence, it has no abstract.
doi: 10.1038/nmeth.1701
Access to the paper: if you have a personal or institutional subscription to
Nature Methods, use the doi: link above.
Access to the supplementary materials:
nmeth.1701-S1.pdf
Other publications
Locating proteins in the cell using TargetP,
SignalP, and related tools
Olof Emanuelsson, Søren Brunak, Gunnar von Heijne, Henrik Nielsen
Nature Protocols, 2:953-971 (2007).
Determining the subcellular localization of a protein is an important
first step toward understanding its function. Here, we describe the
properties of three well-known N-terminal sequence motifs directing
proteins to the secretory pathway, mitochondria and chloroplasts, and
sketch a brief history of methods to predict subcellular localization
based on these sorting signals and other sequence properties. We then
outline how to use a number of internet-accessible tools to arrive at a
reliable subcellular localization prediction for eukaryotic and
prokaryotic proteins. In particular, we provide detailed step-by-step
instructions for the coupled use of the amino-acid sequence-based
predictors TargetP, SignalP, ChloroP and TMHMM, which are all hosted at
the Center for Biological Sequence Analysis, Technical University of
Denmark. In addition, we describe and provide web references to other
useful subcellular localization predictors. Finally, we discuss
predictive performance measures in general and the performance of
TargetP and SignalP in particular.
PMID: 17446895
Please click
here to access the
paper and supplementary materials.
Machine learning approaches to the prediction of signal peptides
and other protein sorting signals.
Henrik Nielsen, Søren Brunak, and Gunnar von Heijne.
Protein Engineering, 12:3-9 (1999), Review.
Prediction of protein sorting signals from the sequence of amino acids has
great importance in the field of proteomics today. Recently, the growth of
protein databases, combined with machine learning approaches, such as neural
networks and hidden Markov models, have made it possible to achieve a level of
reliability where practical use in, for example automatic database annotation
is feasible. In this review, we concentrate on the present status and future
perspectives of SignalP, our neural network-based method for prediction of the
most well-known sorting signal: the secretory signal peptide. We discuss the
problems associated with the use of SignalP on genomic sequences, showing that
signal peptide prediction will improve further if integrated with predictions
of start codons and transmembrane helices. As a step towards this goal, a
hidden Markov model version of SignalP has been developed, making it possible
to discriminate between cleaved signal peptides and uncleaved signal anchors.
Furthermore, we show how SignalP can be used to characterize putative signal
peptides from an archaeon, Methanococcus jannaschii. Finally, we briefly review
a few methods for predicting other protein sorting signals and discuss the
future of protein sorting prediction in general.
PMID: 10065704
A neural network method for identification of prokaryotic and eukaryotic
signal peptides and prediction of their cleavage sites.
Henrik Nielsen, Jacob Engelbrecht, Søren Brunak
and Gunnar von Heijne.
Int. J. Neural Sys., 8:581-599 (1997).
We have developed a new method for the identification of signal peptides and
their cleavage sites based on neural networks trained on separate sets of
prokaryotic and eukaryotic sequences. The method performs significantly better
than previous prediction schemes, and can easily be applied to genome-wide data
sets. Discrimination between cleaved signal peptides and uncleaved N-terminal
signal-anchor sequences is also possible, though with lower precision.
PMID: 10065837
Defining a similarity threshold for a functional protein sequence pattern:
the signal peptide cleavage site.
Henrik Nielsen, Jacob Engelbrecht, Gunnar von Heijne
and Søren Brunak.
Proteins, 24:165-77 (1996).
When preparing data sets of amino acid or nucleotide sequences it is
necessary to exclude redundant or homologous sequences in order to avoid
overestimating the predictive performance of an algorithm. For some time
methods for doing this have been available in the area of protein structure
prediction. We have developed a similar procedure based on pair-wise
alignments for sequences with functional sites. We show how a correlation
coefficient between sequence similarity and functional homology can be used
to compare the efficiency of different similarity measures and choose a
nonarbitrary threshold value for excluding redundant sequences. The impact
of the choice of scoring matrix used in the alignments is examined. We
demonstrate that the parameter determining the quality of the correlation is
the relative entropy of the matrix, rather than the assumed (PAM or
identity) substitution mode. Results are presented for the case of
prediction of cleavage sites in signal peptides. By inspection of the false
positives, several errors in the database were found. The procedure
presented may be used as a general outline for finding a problem-specific
similarity measure and threshold value for analysis of other functional
amino acid or nucleotide sequence patterns.
PMID: 8820484
From sequence to sorting: Prediction of signal peptides.
Henrik Nielsen.
Ph.D. thesis, defended at Department of Biochemistry,
Stockholm University, Sweden, May 25, 1999.
In the present age of genome sequencing, a vast number of predicted
genes are initially known only by their putative nucleotide
sequence. The newly established field of bioinformatics is concerned
with the computational prediction of structural and functional
properties of genes and the proteins they encode, based on their
nucleotide and amino acid sequences.
Since one of the crucial properties of a protein is its subcellular
location, prediction of protein sorting is an important question in
bioinformatics. A fundamental distinction in protein sorting is that
between secretory and non-secretory proteins, determined by a
cleavable N-terminal sorting signal, the secretory signal peptide.
The main part of this thesis, including four of the six papers,
concerns prediction of secretory signal peptides in both eukaryotic
and bacterial data using two machine learning techniques: artificial
neural networks and hidden Markov models. A central result is the
SignalP prediction method, which has been made available as a World
Wide Web server and is very widely used.
Two additional prediction methods are also included, with one paper
each. ChloroP predicts chloroplast transit peptides, another
cleavable N-terminal sorting signal; while NetStart predicts start
codons in eukaryotic genes. For prediction of all N-terminal signals,
the assignment of correct start codon can be critical, which is why
prediction of translation initiation from the nucleotide sequence is
also important for protein sorting prediction.
This thesis comprises a detailed review of the molecular biology of
protein secretion, a short introduction to the most important machine
learning algorithms in bioinformatics, and a critical review of
existing methods for protein sorting prediction. In addition, it
contains general treatment of the principles of data set construction
and performance evaluation for prediction methods in bioinformatics.
Access to the thesis (without the six included papers):
PhDthesis.pdf; PhDthesis-cover.pdf
Instructions
1. Specify the input sequences
All the input sequences must be in one-letter amino acid
code. The allowed alphabet (not case sensitive) is as follows:
A C D E F G H I K L M N P Q R S T V W Y and X (unknown)
All the alphabetic symbols not in the allowed alphabet
will be converted to X before processing. All the non-alphabetic
symbols, including white space and digits, will be ignored.
The sequences can be input in the following two ways:
-
Paste a single sequence (just the amino acids) or a number of sequences in
FASTA
format into the upper window of the main server page.
-
Select a FASTA
file on your local disk, either by typing the file name into the lower window
or by browsing the disk.
Both ways can be employed at the same time: all the specified sequences will
be processed. However, there may be not more than 2,000 sequences and
200,000 amino acids in total in one submission. The sequences
may not be longer than 6,000 amino acids.
2. Customize your run
- Organism group:
It is important for performance that you choose the correct organism
group —
Eukaryotes, Gram-negative bacteria or Gram-positive bacteria —
since the signal peptides of these three groups are known to differ
from each other.
Gram-positive bacteria correspond to
Actinobacteria and
Firmicutes in the
NCBI Taxonomy.
Gram-negative bacteria are all other
eubacteria, except
Tenericutes (including
Mycoplasma), which seem to lack a type I signal peptidase and
therefore do not have standard signal peptides.
Unfortunately, we are
unable to provide a SignalP version for
Archaea, since there are too few experimentally confirmed signal
peptides from this organism group in the
UniProt database (click
here to repeat the search).
- D-cutoff values:
The default cutoff values for SignalP 4 are chosen to optimize the
performance measured as Matthews Correlation Coefficient (MCC). This
results in a lower sensitivity (true positive rate) than
SignalP 3.0
had. In SignalP 4.1, we have introduced the option of setting the
cutoff to a lower value which yields the same sensitivity as SignalP
3.0. This will make the false positive rate slightly higher, but
still better than that of SignalP 3.0. Read more on the Performance page.
You can see which cutoff values are being used in the boxes marked
"D-cutoff". They will change if you change the setting for
"D-cutoff values" or "Organism group".
If you want to experiment with your own cutoff
values, select "User defined" and the boxes will go blank, ready for
you to fill in values between 0 and 1.
- Graphics output:
In the default output, SignalP embeds one plot in PNG format
per sequence, showing the C-, S-, and Y-scores for each position in
the sequence. You can choose to avoid the plots (No graphics) or to add
an Encapsulated PostScript (EPS) file for each sequence. The EPS
files will be provided as links.
See the Output format for an example and explanation of
the scores.
- Output format:
You can choose between four output formats:
- Standard
- Appropriate for most users. Shows one plot and one summary per sequence.
- Short
- Convenient if you submit lots of sequences. Shows only one line of
output per sequence. Incompatible with graphics.
- Long
- Shows the C-, S-, and Y-scores for each position in
the sequence in addition to the Standard output.
- All
- Shows the output scores of both neural network types (SignalP-TM
and SignalP-noTM) for each position in
the sequence. Incompatible with graphics.
See the Output format for an example and explanation of
the scores.
- Method:
Signalp 4.1 contains two types of neural networks. SignalP-TM has
been trained with sequences containing transmembrane segments in the
data set, while SignalP-noTM has been trained without those
sequences. Per default, SignalP 4.1 uses SignalP-TM as a preprocessor to determine
whether to use SignalP-TM or SignalP-noTM in the final prediction
(if 4 or more positions are predicted to be in a transmembrane
state, SignalP-TM is used, otherwise SignalP-noTM).
An exception is Gram-positive bacteria, where SignalP-TM is used
always.
If you are confident that there are no transmembrane segments in
your data, you can get a slightly better performance by choosing
"Input sequences do not include TM regions", which will tell SignalP
4.1 to use SignalP-noTM always.
- Positional limits:
- Minimal predicted signal peptide length
- SignalP 4.0 could, in rare cases, erroneously predict signal peptides
shorter than 10 residues. These errors have in SignalP 4.1 been
eliminated by imposing a lower limit on the cleavage site
position (signal peptide length). The minimum length is by default 10, but
you can adjust it. Signal peptides shorter than 15 residues are very rare.
If you want to disable this
length restriction completely, enter 0 (zero).
- N-terminal truncation of input sequence
- By default, the predictor truncates each sequence to max.
70 residues before submitting it to the neural networks. If you
want to predict extremely long signal peptides, you can try a
higher value, or disable truncation completely by entering 0
(zero). Note: The neural networks are trained with sequences
with a maximal length of 70, and they include the relative
position in the sequence in their input. Therefore, general performance
will deteriorate if you change this setting.
3. Submit the job
Click on the
"Submit" button. The status of your job (either 'queued'
or 'running') will be displayed and constantly updated until it terminates and
the server output appears in the browser window.
At any time during the wait you may enter your e-mail address and simply leave
the window. Your job will continue; you will be notified by e-mail when it has
terminated. The e-mail message will contain the URL under which the results are
stored; they will remain on the server for 24 hours for you to collect them.
Output format
DESCRIPTION OF THE SCORES
The neural networks in SignalP produce three output scores for each
position in the input sequence:
- C-score (raw cleavage site score)
- The output from the CS networks, which are trained to
distinguish signal peptide cleavage sites from everything else.
Note the position numbering of the cleavage site: the C-score is
trained to be high at the position immediately after the
cleavage site (the first residue in the mature protein).
- S-score (signal peptide score)
- The output from the SP networks, which are trained to
distinguish positions within signal peptides from positions in
the mature part of the proteins and from proteins without signal peptides.
- Y-score (combined cleavage site score)
- A combination (geometric average) of the C-score and the slope
of the S-score, resulting in a better cleavage site prediction than the
raw C-score alone. This is due to the fact that multiple
high-peaking C-scores can be found in one sequence, where only one
is the true cleavage site. The Y-score distinguishes between C-score peaks
by choosing the one where the slope of the S-score is steep.
The graphical output from SignalP (see below) shows the three different
scores, C, S and Y, for each position in the
sequence.
In the summary below the plot, the maximal values of
the three scores are reported. In addition, the following two scores are
shown:
- mean S
- The average S-score of the possible signal peptide (from
position 1 to the position immediately before the maximal Y-score).
- D-score (discrimination score)
- A weighted average of the mean S and the max. Y scores. This is
the score that is used to discriminate signal peptides from non-signal
peptides.
For non-secretory proteins all the scores represented in the
SignalP output should ideally be very low (close to the negative target
value of 0.1).
EXAMPLE OUTPUT
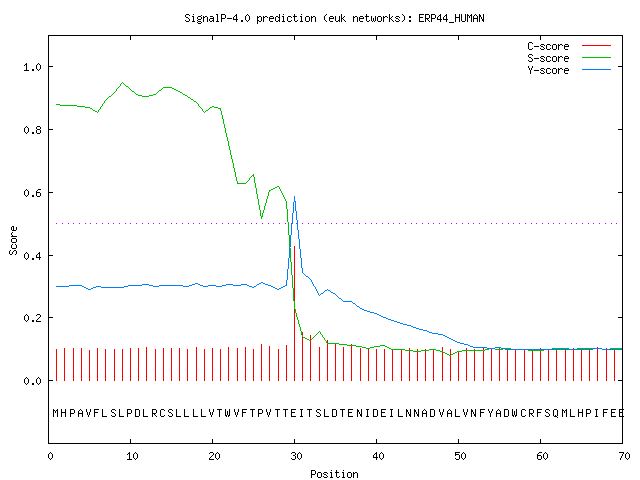
By default the server produces the following output for each input sequence:
Example: secretory protein — standard output format
The example below shows the output for thioredoxin domain containing
protein 4 precursor (endoplasmic reticulum protein ERp44), taken from the
Swiss-Prot
entry
ERP44_HUMAN.
The signal peptide prediction is consistent with the database annotation.
# SignalP-4.1 euk predictions
>sp_Q9BS26_ERP44_HUMAN  Endoplasmic reticulum resident protein 44 OS_Homo sapiens GN_ERP44 PE_1 SV_1


# Measure  Position  Value    Cutoff   signal peptide?
  max. C    30       0.427
  max. Y    30       0.586
  max. S     9       0.950
  mean S     1-29    0.821
       D     1-29    0.713   0.450   YES
Name=sp_Q9BS26_ERP44_HUMAN	SP='YES' Cleavage site between pos. 29 and 30: VTT-EI D=0.713 D-cutoff=0.450 Networks=SignalP-noTM
# data
# gnuplot script

Signal peptides: 1
# processed fasta entries
# gff file of processed entries
# Measure Position Value Cutoff signal peptide?
max. C 30 0.427
max. Y 30 0.586
max. S 9 0.950
mean S 1-29 0.821
D 1-29 0.713 0.450 YES
Name=sp_Q9BS26_ERP44_HUMAN SP='YES' Cleavage site between pos. 29 and 30: VTT-EI D=0.713 D-cutoff=0.450 Networks=SignalP-noTM
# data
# gnuplot script
Signal peptides: 1
# processed fasta entries
# gff file of processed entries
Below the summary for each sequence, two files are provided via links:
"data" and "gnuplot script". If you have the free graphics program
gnuplot on your computer, you can
use these two files to customize your plot.
Below the output for all the sequences, two other files are provided via
links, if at least one signal peptide has been predicted. These are
"processed fasta entries", a FASTA sequence file containing the
sequences of protein that had predicted signal peptides, with the signal
peptide removed; and "gff file of processed entries", a file showing the
signal peptides feature of those proteins that had predicted signal
peptides in
GFF
format.
Example: secretory protein — short output format
# SignalP-4.0 euk predictions
# name                     Cmax  pos  Ymax  pos  Smax  pos  Smean   D     ?  Dmaxcut    Networks-used
ERP44_HUMAN                0.427  30  0.586  30  0.950   9  0.821   0.713 Y  0.450      SignalP-noTM
Performance of SignalP 4.1
Correlation
In the SignalP 4.0 article, we show that
SignalP 4.0 is superior in performance to SignalP 3.0 and ten competing
methods (five dedicated signal peptide predictors and five transmembrane
topology predictors with built-in signal peptide models), when the
performance is measured by Matthews Correlation Coefficient (MCC).
Matthews Correlation Coefficient is a very widely used measure for
performance in bioinformatics. It is defined thus:
where
- tp is the number of true positives (signal peptides predicted as such)
- tn is the number of true negatives (non-signal peptides predicted as such)
- fp is the number of false positives (erroneous signal peptide predictions)
- fn is the number of false negatives (missed signal peptides)
and it takes the value of 1 for a perfect prediction, 0 for a random (non-informative)
prediction,
and -1 for a consistently wrong prediction.
In Table E (pp. 10-11) of the
supplementary materials you can see the MCC values
for SignalP and the competing methods.
Sensitivity, false positive rate and cutoff choice
However, SignalP 4.0 is not superior to SignalP 3.0 according to all
performance measures. Notably, the sensitivity is lower when you
use the default cutoff. Sensitivity is the
proportion of the true signal peptides that are correctly predicted:
All prediction methods that make a classification from a numerical
output have a choice to make: where to place the cutoff (also known as
threshold) for the output? If you use a high cutoff, you will get
few false positives, but also a low sensitivity; if you lower the
cutoff, you will get a better sensitivity at the price of more false
positives. The false positive rate is defined as:
There is no single correct answer to the problem of choosing the
cutoff, it depends on the contet in which the prediction method is used.
For SignalP, we have used a cutoff on the D-score
(see the Output format for a definition) that
maximizes the MCC.
ROC curves
The trade-off between sensitivity and false positive rate is often
illustrated graphically as a so-called
ROC curve
which has false positive rate
on the x-axis and sensitivity on the y-axis for varying
values of the cutoff. The better a predition method is, the closer to the upper left corner the
ROC curve will be, while a random (non-informative) prediction will follow
the diagonal. This is an
excellent way to compare different predictors, since it is not dependent
on cutoff choice.
Below, you can see ROC curves for SignalP 3 and 4 for the three
different organism groups. Note: in contrast to the values in Table E,
these are not evaluation performances; they are made by applying the finished
methods to the Total data set before homology reduction.
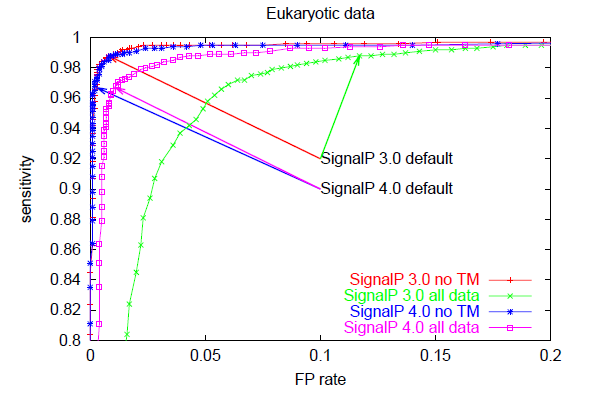
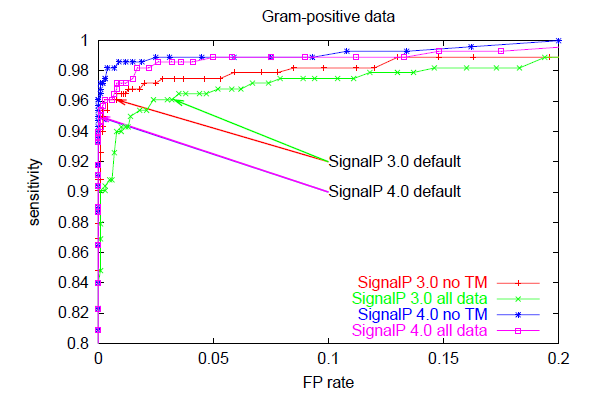
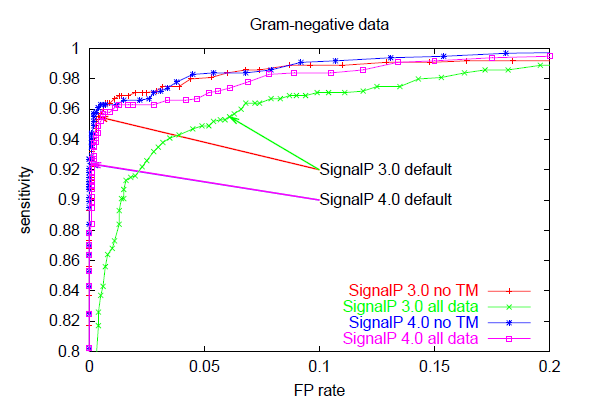
These ROC curves show that:
- When there are TM segments in the data ("all data"), SignalP 4.0 is
clearly better than SignalP 3.0 (compare the pink and green curves)
- When TM segments are excluded from the data ("no TM"), SignalP 4.0
performance is practically equal to that of SignalP 3.0 —
except in the Gram-positives, where it is better
(compare the blue and red curves)
- SignalP 4.0 and 3.0 default cutoffs are placed at very different points
on the ROC curves, leading to lower sensitivity (and much lower FP rates)
in SignalP 4.0.
The cutoff choice in SignalP 4.1
SignalP 4.1 offers the users an option of using cutoff values which
reproduce the sensitivity of SignalP 3.0. The price is, of course, a
slightly higher false positive rate.
In the table below, the performace values are shown for SignalP 3.0,
SignalP 4.1 with default cutoff, and SignalP 4.1 with "sensitive"
(SignalP-3.0 compliant) cutoff. Note, again, that these are not
evaluation performances and should not be used to compare SignalP to
competing methods, they are merely for the purpose of comparing SignalP
versions.
| Method | Cutoff,
SignalP-noTM | Cutoff,
SignalP-TM | Sensitivity
| FP rate,
no TM | FP rate,
all data
| MCC,
no TM | MCC,
all data |
| Eukaryotic data |
| SignalP 3.0 | 0.43 | 0.988 | 0.008 | 0.117 | 0.978 | 0.781 |
| SignalP 4.1 default | 0.45 | 0.50 | 0.967 | 0.003 | 0.011 | 0.972 | 0.955 |
| SignalP 4.1 sensitive | 0.34 | 0.34 | 0.988 | 0.009 | 0.043 | 0.976 | 0.903 |
| Gram-positive data |
| SignalP 3.0 | 0.45 | 0.961 | 0.008 | 0.033 | 0.937 | 0.814 |
| SignalP 4.1 default | 0.57 | 0.45 | 0.950 | 0.000 | 0.001 | 0.973 | 0.967 |
| SignalP 4.1 sensitive | 0.42 | 0.42 | 0.961 | 0.000 | 0.003 | 0.978 | 0.958 |
| Gram-negative data |
| SignalP 3.0 | 0.44 | 0.955 | 0.004 | 0.061 | 0.949 | 0.691 |
| SignalP 4.1 default | 0.57 | 0.51 | 0.924 | 0.000 | 0.001 | 0.957 | 0.949 |
| SignalP 4.1 sensitive | 0.42 | 0.42 | 0.955 | 0.002 | 0.006 | 0.963 | 0.937 |
Examples of proteome predictions for three organism types
Eukaryota - Human proteom GRCh37.62
short
gff
mature
Gram positive bacteria - B.subtilis EB2
short
gff
mature
Gram negative bacteria - E.coli K12
short
gff
mature
Training and testing data sets
These are the annotated sequence data described in Table A of the
Supplementary Materials. The entire
datasets correspond to the "Total" columns in the table (before homology
reduction). Sequences labeled "Train" correspond to the "Train" columns
in the table, while sequences labeled "Evaluation" correspond to the
"Comp." columns in the table (used for comparing the performance to
SignalP 3.0 and other methods). Sequences used to train SignalP 3.0 (or
homologous to those used to train SignalP 3.0) have been removed from
the "Comp." sets.
Note that the "Comp." sets are subsets of the "Train" sets. The
evaluation of SignalP 4.0 was done using a nested cross-validation
approach, where different partitions were used for training,
optimization and evaluation, see Supplementary Materials for details.
   166 AJL2_ANGJA Evaluation
MVSFKLPAFLCVAVLSSMALVSHGAVLGLCEGACPEGWVEHKNRCYLHVAEKKTWLDAELNCLHHGGNLASEHSEDEHQF
LKDLHKGSDDPFWIGLSAVHEGRSWLWSDGTSASAEGDFSMWNPGEPNDAGGKEDCVHDNYGGQKHWNDIKCDLLFPSIC
VLRMVE
SSSSSSSSSSSSSSSSSSSSSSSS........................................................
................................................................................
......
   503 A1BG_BOVIN  Evaluation Train
MSAWAALLLLWGLSLSPVTEQATFFDPRPSLWAEAGSPLAPWADVTLTCQSPLPTQEFQLLKDGVGQEPVHLESPAHEHR
FPLGPVTSTTRGLYRCSYKGNNDWISPSNLVEVTGAEPLPAPSISTSPVSWITPGLNTTLLCLSGLRGVTFLLRLEGEDQ
FLEVAEAPEATQATFPVHRAGNYSCSYRTHAAGTPSEPSATVTIEELDPPPAPTLTVDRESAKVLRPGSSASLTCVAPLS
GVDFQLRRGAEEQLVPRASTSPDRVFFRLSALAAGDGSGYTCRYRLRSELAAWSRDSAPAELVLSDGTLPAPELSAEPAI
LSPTPGALVQLRCRAPRAGVRFALVRKDAGGRQVQRVLSPAGPEAQFELRGVSAVDSGNYSCVYVDTSPPFAGSKPSATL
ELRVDGPLPRPQLRALWTGALTPGRDAVLRCEAEVPDVSFLLLRAGEEEPLAVAWSTHGPADLVLTSVGPQHAGTYSCRY
RTGGPRSLLSELSDPVELRVAGS
SSSSSSSSSSSSSSSSSSSSS...........................................................
................................................................................
................................................................................
................................................................................
................................................................................
................................................................................
.......................
The format is:
- First a header line with number of amino acids, sequence name (UniProt ID)
and possibly a description field ('Evaluation'/'Train').
- The protein sequence.
- The annotations, one for each amino acid.
Annotations:
S — Amino acid is part of a Signal peptide (experimentally verified)
T — Amino acid is part of a Transmembrane region (experimentally verified)
t — Amino acid is part of a Transmembrane region (not experimentally verified)
. — An annotation different from those shown above
Eukaryota sequence data
Gram positive sequence data
Gram negative sequence data
Version history
Please click on the version number to activate the corresponding server where available.
|
4.1
|
The current server. New in this version:
- For the web page, an option to set the D-score cutoff values so
that the sensitivity is the same as that of SignalP 3.0.
- Option included to set the minimum cleavage site position i.e. Ymax position - default value is 10.
- For the signalp package an option has been included to specify a temporary directory (-T dir).
- For the signalp package an option has been included to show signalp version (-V).
- Documentation rewritten.
Main publication:
-
SignalP 4.0: discriminating signal peptides from transmembrane regions
Thomas Nordahl Petersen, Søren Brunak,
Gunnar von Heijne and Henrik Nielsen.
Nature Methods, 8:785-786, 2011.
|
|
4.0
|
New in this version:
- Improved discrimination between signal peptides and transmembrane regions.
- No HMM method - only one prediction.
Main publication:
-
SignalP 4.0: discriminating signal peptides from transmembrane regions
Thomas Nordahl Petersen, Søren Brunak,
Gunnar von Heijne and Henrik Nielsen.
Nature Methods, 8:785-786, 2011.
|
|
3.0
|
New in this version:
- D-score. Improved quality of prediction.
Main publication:
-
Improved prediction of signal peptides: SignalP 3.0.
Jannick Dyrløv Bendtsen, Henrik Nielsen,
Gunnar von Heijne and Søren Brunak.
J. Mol. Biol., 340:783-795, 2004.
|
|
2.0
|
New in this version:
- Incorporation of a hidden Markov model version:
SignalP V2.0 comprises two signal peptide prediction methods,
SignalP-NN (based on neural networks, corresponding to SignalP V1.1)
and SignalP-HMM (based on hidden Markov models). For eukaryotic data,
SignalP-HMM has a substantially improved discrimination between signal
peptides and uncleaved signal anchors, but it has a slightly lower
accuracy in predicting the precise location of the cleavage site.
The user can choose whether to run SignalP-NN, SignalP-HMM, or both.
- Retraining of the neural networks:
SignalP-NN in SignalP V2.0 is trained on a newer data set derived
from SWISS-PROT rel. 35 (instead of rel. 29 as in SignalP V1.1).
- Graphics integrated in the output:
SignalP V2.0 shows signal peptide and cleavage site scores for each
position as plots in GIF format on the output page. The plots provide
more information than the prediction summary, e.g. about possible
cleavage sites other than the strongest prediction.
- Signal peptide region assignment:
SignalP-HMM provides not only a prediction of the presence of a signal
peptide and the position of the cleavage site, but also an approximate
assignment of n-, h- and c-regions within the signal peptide. These are
shown in the graphical output as probabilities for each position being
in one of these three regions.
- Automatic truncation:
in SignalP V1.1, we recommended that you should submit only the
N-terminal part of each protein, not more than 50-70 amino acids.
SignalP V2.0 now offers to truncate your sequences automatically.
Main publication:
-
Prediction of signal peptides and signal anchors by a hidden
Markov model.
Henrik Nielsen and Anders Krogh.
Proceedings of the Sixth International Conference on Intelligent
Systems for Molecular Biology (ISMB 6),
AAAI Press, Menlo Park, California, pp. 122-130, 1998.
|
|
1.1
|
The original server: the method based on artificial
neural networks.
Main publication:
-
Identification of prokaryotic and eukaryotic signal peptides
and prediction of their cleavage sites.
Henrik Nielsen, Jacob Engelbrecht, Søren Brunak
and Gunnar von Heijne.
Protein Engineering, 10:1-6, 1997.
|
Software Downloads
- Version 6.0h
- Version 5.0b
- Version 4.1g
- Version 3.0
- Version 2.0
If you need help regarding technical issues (e.g. errors or missing results) contact Technical Support. Please include the name of the service and version (e.g. NetPhos-4.0) and the options you have selected. If the error occurs after the job has started running, please include the JOB ID (the long code that you see while the job is running).
If you have scientific questions (e.g. how the method works or how to interpret results), contact Correspondence.
Correspondence:
Technical Support: