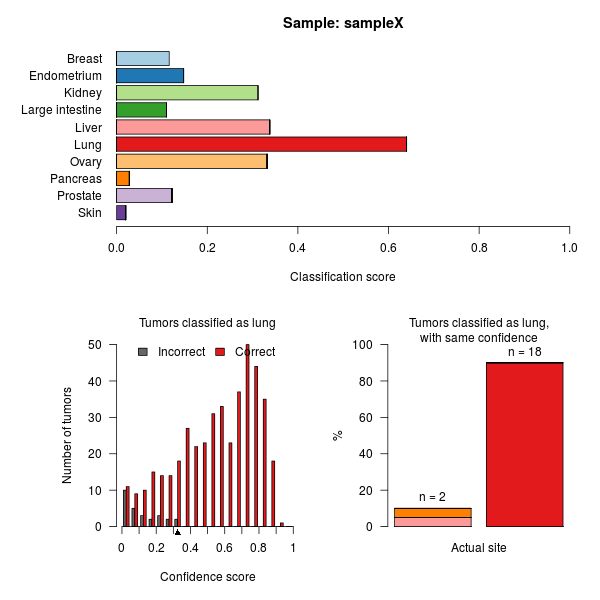
The top panel shows the output of TumorTracer when applied to the current tumor. The lower panels are based on test data, only.
- Top panel: The classification score given to the current tumor for each tissue is shown. The confidence score is defined as the difference between the top two classification scores.
- Lower left: The distribution of confidence scores among tumors in the test data (obtained during cross-validation). Only the tumors classified to the same primary site as the current tumor are shown.
The confidence score of the current tumor is marked with a black triangle.
- Lower right: The actual primary sites of those tumors in the test set that were classified to the same primary site, AND with a similar confidence score, are shown.