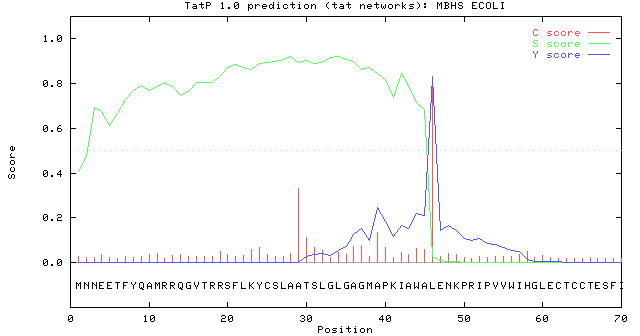
Examples of standard output
Examples of short output
DESCRIPTION OF THE SCORES
The scores and graphical output is almost identical to the output of the SignalP server. The presented scores are calculated in the same way as for SignalP.
The graphical output from TatP (neural network) comprises three different scores, C, S and Y. Two additional scores are reported in the SignalP3-NN output, namely the S-mean and the D-score, but these are only reported as numerical values.
For each prediction, two different neural networks are used, one for predicting the actual signal peptide and one for predicting the position of the signal peptidase I (SPase I) cleavage site. The S-score for the signal peptide prediction is reported for every single amino acid position in the submitted sequence, with high scores indicating that the corresponding amino acid is part of a signal peptide, and low scores indicating that the amino acid is part of a mature protein.
The C-score is the ``cleavage site'' score. For each position in the submitted sequence, a C-score is reported, which should only be significantly high at the cleavage site. Confusion is often seen with the position numbering of the cleavage site. When a cleavage site position is referred to by a single number, the number indicates the first residue in the mature protein, meaning that a reported cleavage site between amino acid 26-27 corresponds to that the mature protein starts at (and include) position 27.
Y-max is a derivative of the C-score combined with the S-score resulting in a better cleavage site prediction than the raw C-score alone. This is due to the fact that multiple high-peaking C-scores can be found in one sequence, where only one is the true cleavage site. The cleavage site is assigned from the Y-score where the slope of the S-score is steep and a significant C-score is found.
The S-mean is the average of the S-score, ranging from the N-terminal amino acid to the amino acid assigned with the highest Y-max score, thus the S-mean score is calculated for the length of the predicted signal peptide.
The D-score is introduced in SignalP version 3.0 and is a simple average of the S-mean and Y-max score. The score shows superior discrimination performance of secretory and non-secretory proteins to that of the S-mean score which was used in SignalP version 1 and 2. In TatP the D-score is used for final discrimination of secretory vs. non-secretory.
For non-secretory proteins all the scores represented in the TatP-NN output should ideally be very low.
EXAMPLES OF STANDARD OUTPUT
By default the server produces the following output for each input sequence:
Example 1: Secretory protein with Tat signal peptide
The example below shows the output for Membrane-bound hydrogenase 1 small subunit, taken from the Swiss-Prot entry MBHS_ECOLI. The signal peptide prediction is consistent with the database annotation.MBHS_ECOLI TatP-NN result:
# data
>MBHS_ECOLI length = 70 # Measure Position Value Cutoff signal peptide? max. C 46 0.831 0.48 YES max. Y 46 0.826 0.41 YES max. S 34 0.923 0.84 YES mean S 1-45 0.804 0.46 YES max. D 1-45 0.815 0.44 YES # Most likely cleavage site between pos. 45 and 46: AWA-LE # Found RRQGV as Tat motif starting at position 12 Used regex: RR.[FGAVML][LITMVF] //
EXAMPLE OF SHORT OUTPUT
When selecting the short output format, the prediction for each submitted sequence (in a multisequence FASTA file) are reported in a condensed text form without any graphical output. All entries are separated by a "//". The following example show one positive and one negative prediction. The regular expression entered on the webpage is also presented in the output.>MBHS_ECOLI length = 70 # Measure Position Value Cutoff signal peptide? max. C 46 0.831 0.48 YES max. Y 46 0.826 0.41 YES max. S 34 0.923 0.84 YES mean S 1-45 0.804 0.46 YES max. D 1-45 0.815 0.44 YES # Most likely cleavage site between pos. 45 and 46: AWA-LE # Found RRQGV as Tat motif starting at position 12 Used regex: RR.[FGAVML][LITMVF] // >AAT_THEMA length = 70 # Measure Position Value Cutoff signal peptide? max. C 22 0.279 0.48 NO max. Y 22 0.090 0.41 NO max. S 6 0.102 0.84 NO mean S 1-21 0.057 0.46 NO max. D 1-21 0.073 0.44 NO Used regex: RR.[FGAVML][LITMVF] //
