Output format
DESCRIPTION OF THE SCORES
The neural networks in SignalP produce three output scores for each
position in the input sequence:
- C-score (raw cleavage site score)
- The output from the CS networks, which are trained to
distinguish signal peptide cleavage sites from everything else.
Note the position numbering of the cleavage site: the C-score is
trained to be high at the position immediately after the
cleavage site (the first residue in the mature protein).
- S-score (signal peptide score)
- The output from the SP networks, which are trained to
distinguish positions within signal peptides from positions in
the mature part of the proteins and from proteins without signal peptides.
- Y-score (combined cleavage site score)
- A combination (geometric average) of the C-score and the slope
of the S-score, resulting in a better cleavage site prediction than the
raw C-score alone. This is due to the fact that multiple
high-peaking C-scores can be found in one sequence, where only one
is the true cleavage site. The Y-score distinguishes between C-score peaks
by choosing the one where the slope of the S-score is steep.
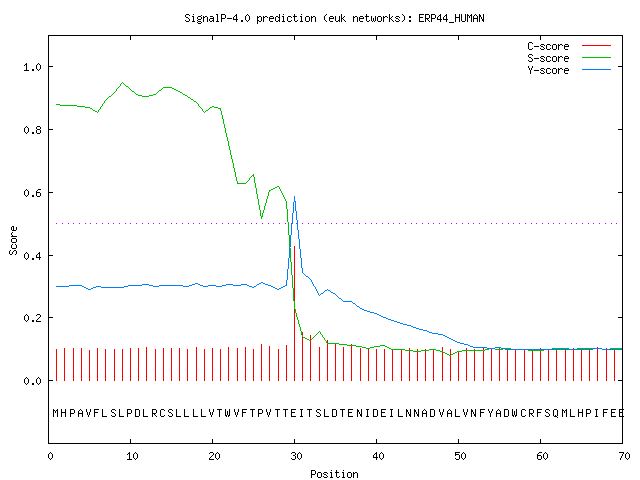
The graphical output from SignalP (see below) shows the three different
scores, C, S and Y, for each position in the
sequence.
In the summary below the plot, the maximal values of
the three scores are reported. In addition, the following two scores are
shown:
- mean S
- The average S-score of the possible signal peptide (from
position 1 to the position immediately before the maximal Y-score).
- D-score (discrimination score)
- A weighted average of the mean S and the max. Y scores. This is
the score that is used to discriminate signal peptides from non-signal
peptides.
For non-secretory proteins all the scores represented in the
SignalP output should ideally be very low (close to the negative target
value of 0.1).
EXAMPLE OUTPUT
By default the server produces the following output for each input sequence:
Example: secretory protein — standard output format
The example below shows the output for thioredoxin domain containing
protein 4 precursor (endoplasmic reticulum protein ERp44), taken from the
Swiss-Prot
entry
ERP44_HUMAN.
The signal peptide prediction is consistent with the database annotation.
# SignalP-4.1 euk predictions
>sp_Q9BS26_ERP44_HUMAN  Endoplasmic reticulum resident protein 44 OS_Homo sapiens GN_ERP44 PE_1 SV_1


# Measure  Position  Value    Cutoff   signal peptide?
  max. C    30       0.427
  max. Y    30       0.586
  max. S     9       0.950
  mean S     1-29    0.821
       D     1-29    0.713   0.450   YES
Name=sp_Q9BS26_ERP44_HUMAN	SP='YES' Cleavage site between pos. 29 and 30: VTT-EI D=0.713 D-cutoff=0.450 Networks=SignalP-noTM
# data
# gnuplot script

Signal peptides: 1
# processed fasta entries
# gff file of processed entries
# Measure Position Value Cutoff signal peptide?
max. C 30 0.427
max. Y 30 0.586
max. S 9 0.950
mean S 1-29 0.821
D 1-29 0.713 0.450 YES
Name=sp_Q9BS26_ERP44_HUMAN SP='YES' Cleavage site between pos. 29 and 30: VTT-EI D=0.713 D-cutoff=0.450 Networks=SignalP-noTM
# data
# gnuplot script
Signal peptides: 1
# processed fasta entries
# gff file of processed entries
Below the summary for each sequence, two files are provided via links:
"data" and "gnuplot script". If you have the free graphics program
gnuplot on your computer, you can
use these two files to customize your plot.
Below the output for all the sequences, two other files are provided via
links, if at least one signal peptide has been predicted. These are
"processed fasta entries", a FASTA sequence file containing the
sequences of protein that had predicted signal peptides, with the signal
peptide removed; and "gff file of processed entries", a file showing the
signal peptides feature of those proteins that had predicted signal
peptides in
GFF
format.
Example: secretory protein — short output format
# SignalP-4.0 euk predictions
# name                     Cmax  pos  Ymax  pos  Smax  pos  Smean   D     ?  Dmaxcut    Networks-used
ERP44_HUMAN                0.427  30  0.586  30  0.950   9  0.821   0.713 Y  0.450      SignalP-noTM