DTU Health Tech
Department of Health Technology
This link is for the general contact of the DTU Health Tech institute.
If you need help with the bioinformatics programs, see the "Getting Help" section below the program.
DTU Health Tech
Department of Health Technology
This link is for the general contact of the DTU Health Tech institute.
If you need help with the bioinformatics programs, see the "Getting Help" section below the program.
 |
ATM, CKI, CKII, CaM-II, DNAPK, EGFR, GSK3, INSR, PKA, PKB, PKC, PKG, RSK, SRC, cdc2, cdk5 and p38MAPK.
Sequence submission: paste the sequence(s) and/or upload a local file
Restrictions:
At most 2000 sequences and 200,000 amino acids
per submission; each sequence not less than 15 and not more than 4,000 amino
acids.
Confidentiality:
The sequences are kept confidential and will be
deleted after processing.
For publication of results, please cite:
Generic predictions:
Sequence- and structure-based prediction of eukaryotic protein
phosphorylation sites.
Blom, N., Gammeltoft, S., and Brunak, S.
Journal of Molecular Biology: 294(5): 1351-1362, 1999.
PMID: 10600390
Kinase specific predictions:
Prediction of post-translational glycosylation and phosphorylation of
proteins from the amino acid sequence.
Blom N, Sicheritz-Ponten T, Gupta R, Gammeltoft S, Brunak S.
Proteomics: Jun;4(6):1633-49, review 2004.
PMID: 15174133
The characters not in the one-letter amino acid code e.g. letters like 'B' or 'Z', digits and other non-alphabetic symbols will all be converted to X before processing; they will be accepted but not used when making the predictions. White space within the sequences, if any, will be ignored. The sequences can be input in the following two ways:
At any time during the wait you may enter your e-mail address and simply
leave the window. Your job will continue; you will be notified by e-mail
when it has terminated. The e-mail message will contain the URL under which
the results are stored; they will remain on the server for 24 hours for you
to collect them.
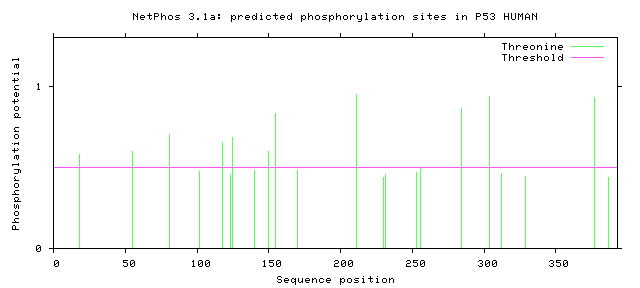
>P53_HUMAN	393 amino acids
#
# netphos-3.1b prediction results
#
# Sequence		   # x   Context     Score   Kinase    Answer
# -------------------------------------------------------------------
# P53_HUMAN               18 T   LSQETFSDL   0.582   CKI        YES
# P53_HUMAN               55 T   EQWFTEDPG   0.598   CKII       YES
# P53_HUMAN               81 T   PAAPTPAAP   0.704   unsp       YES
# P53_HUMAN              102 T   PSQKTYQGS   0.472   cdc2        .
# P53_HUMAN              118 T   LHSGTAKSV   0.654   PKC        YES
# P53_HUMAN              123 T   AKSVTCTYS   0.455   GSK3        .
# P53_HUMAN              125 T   SVTCTYSPA   0.684   PKC        YES
# P53_HUMAN              140 T   QLAKTCPVQ   0.479   cdc2        .
# P53_HUMAN              150 T   WVDSTPPPG   0.599   unsp       YES
# P53_HUMAN              155 T   PPPGTRVRA   0.829   unsp       YES
# P53_HUMAN              170 T   SQHMTEVVR   0.482   unsp        .
# P53_HUMAN              211 T   DDRNTFRHS   0.951   unsp       YES
# P53_HUMAN              230 T   GSDCTTIHY   0.438   GSK3        .
# P53_HUMAN              231 T   SDCTTIHYN   0.454   GSK3        .
# P53_HUMAN              253 T   RPILTIITL   0.467   CaM-II      .
# P53_HUMAN              256 T   LTIITLEDS   0.492   cdc2        .
# P53_HUMAN              284 T   RDRRTEEEN   0.865   unsp       YES
# P53_HUMAN              304 T   PPGSTKRAL   0.939   unsp       YES
# P53_HUMAN              312 T   LPNNTSSSP   0.459   CaM-II      .
# P53_HUMAN              329 T   GEYFTLQIR   0.443   GSK3        .
# P53_HUMAN              377 T   KGQSTSRHK   0.932   unsp       YES
# P53_HUMAN              387 T   LMFKTEGPD   0.440   GSK3        .
#
    MEEPQSDPSVEPPLSQETFSDLWKLLPENNVLSPLPSQAMDDLMLSPDDI   #     50
    EQWFTEDPGPDEAPRMPEAAPPVAPAPAAPTPAAPAPAPSWPLSSSVPSQ   #    100
    KTYQGSYGFRLGFLHSGTAKSVTCTYSPALNKMFCQLAKTCPVQLWVDST   #    150
    PPPGTRVRAMAIYKQSQHMTEVVRRCPHHERCSDSDGLAPPQHLIRVEGN   #    200
    LRVEYLDDRNTFRHSVVVPYEPPEVGSDCTTIHYNYMCNSSCMGGMNRRP   #    250
    ILTIITLEDSSGNLLGRNSFEVRVCACPGRDRRTEEENLRKKGEPHHELP   #    300
    PGSTKRALPNNTSSSPQPKKKPLDGEYFTLQIRGRERFEMFRELNEALEL   #    350
    KDAQAGKEPGGSRAHSSHLKSKKGQSTSRHKKLMFKTEGPDSD          #    400
%1  .................T................................   #     50
%1  ....T.........................T...................   #    100
%1  .................T......T........................T   #    150
%1  ....T.............................................   #    200
%1  ..........T.......................................   #    250
%1  .................................T................   #    300
%1  ...T..............................................   #    350
%1  ..........................T................

##gff-version 2
##source-version netphos-3.1b
##date 2016-07-12
##Type Protein P53_HUMAN
##Protein P53_HUMAN
##MEEPQSDPSVEPPLSQETFSDLWKLLPENNVLSPLPSQAMDDLMLSPDDIEQWFTEDPGP
##DEAPRMPEAAPPVAPAPAAPTPAAPAPAPSWPLSSSVPSQKTYQGSYGFRLGFLHSGTAK
##SVTCTYSPALNKMFCQLAKTCPVQLWVDSTPPPGTRVRAMAIYKQSQHMTEVVRRCPHHE
##RCSDSDGLAPPQHLIRVEGNLRVEYLDDRNTFRHSVVVPYEPPEVGSDCTTIHYNYMCNS
##SCMGGMNRRPILTIITLEDSSGNLLGRNSFEVRVCACPGRDRRTEEENLRKKGEPHHELP
##PGSTKRALPNNTSSSPQPKKKPLDGEYFTLQIRGRERFEMFRELNEALELKDAQAGKEPG
##GSRAHSSHLKSKKGQSTSRHKKLMFKTEGPDSD
##end-Protein
# seqname            source        feature      start   end   score  N/A   ?
# ---------------------------------------------------------------------------
P53_HUMAN            netphos-3.1b  phos-CKI        18    18   0.582  . .  YES
P53_HUMAN            netphos-3.1b  phos-CKII       55    55   0.598  . .  YES
P53_HUMAN            netphos-3.1b  phos-unsp       81    81   0.704  . .  YES
P53_HUMAN            netphos-3.1b  phos-cdc2      102   102   0.472  . .   .
P53_HUMAN            netphos-3.1b  phos-PKC       118   118   0.654  . .  YES
P53_HUMAN            netphos-3.1b  phos-GSK3      123   123   0.455  . .   .
P53_HUMAN            netphos-3.1b  phos-PKC       125   125   0.684  . .  YES
P53_HUMAN            netphos-3.1b  phos-cdc2      140   140   0.479  . .   .
P53_HUMAN            netphos-3.1b  phos-unsp      150   150   0.599  . .  YES
P53_HUMAN            netphos-3.1b  phos-unsp      155   155   0.829  . .  YES
P53_HUMAN            netphos-3.1b  phos-unsp      170   170   0.482  . .   .
P53_HUMAN            netphos-3.1b  phos-unsp      211   211   0.951  . .  YES
P53_HUMAN            netphos-3.1b  phos-GSK3      230   230   0.438  . .   .
P53_HUMAN            netphos-3.1b  phos-GSK3      231   231   0.454  . .   .
P53_HUMAN            netphos-3.1b  phos-CaM-II    253   253   0.467  . .   .
P53_HUMAN            netphos-3.1b  phos-cdc2      256   256   0.492  . .   .
P53_HUMAN            netphos-3.1b  phos-unsp      284   284   0.865  . .  YES
P53_HUMAN            netphos-3.1b  phos-unsp      304   304   0.939  . .  YES
P53_HUMAN            netphos-3.1b  phos-CaM-II    312   312   0.459  . .   .
P53_HUMAN            netphos-3.1b  phos-GSK3      329   329   0.443  . .   .
P53_HUMAN            netphos-3.1b  phos-unsp      377   377   0.932  . .  YES
P53_HUMAN            netphos-3.1b  phos-GSK3      387   387   0.440  . .   .
Phospho.ELM is becoming the primary resource for phosphorylation data. CBS continues to contribute to the database alongside many other research groups.
If you need help regarding technical issues (e.g. errors or missing results) contact Technical Support. Please include the name of the service and version (e.g. NetPhos-4.0) and the options you have selected. If the error occurs after the job has started running, please include the JOB ID (the long code that you see while the job is running).
If you have scientific questions (e.g. how the method works or how to interpret results), contact Correspondence.
Correspondence:
Technical Support: