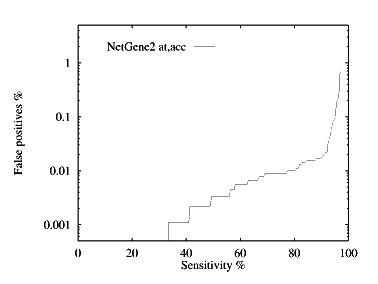
Acceptor site prediction performance
These graphs show the performance, by plotting the false positive % against the specificity %. The graphs are given for each species for both donor and acceptor site prediction.

Acceptor site prediction performance
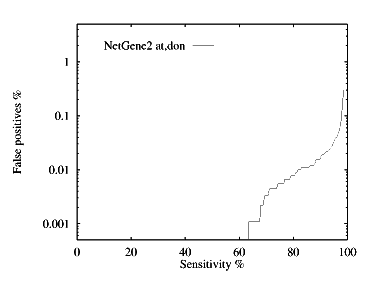
Donor site prediction performance
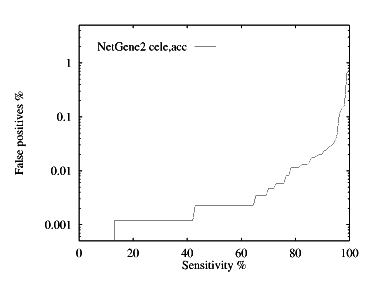
Acceptor site prediction performance
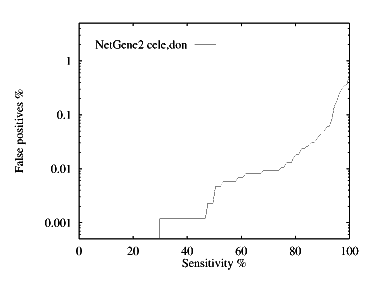
Donor site prediction performance
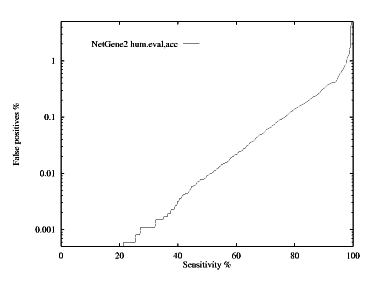
Acceptor site prediction performance
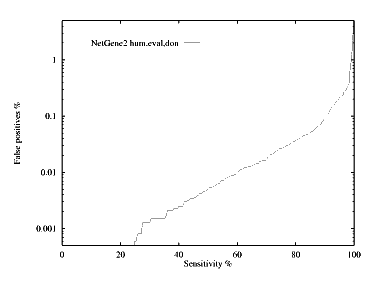
Donor site prediction performance