-
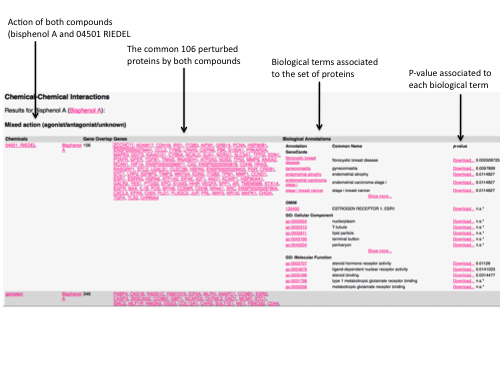
Chemical-chemical interactions
"Mixed action": i.e. one chemical has an agonist effect on the ensembl of proteins whereas the second chemical has an antagonist or binding effect (defined as unknow)
"Agonists only": i.e. both chemicals have an agonist effect on the same set of proteins
"Antagonists only": i.e. both chemicals have an antagonist effect on the same set of proteins
For each chemical-chemical interaction output, the enrichment of the proteins sets is annotated and sorted with a p-value adjusted to the respective data used (Bonferroni adjustement for multiple testing), i.e. OMIM, GeneCards, KEGG-pathway, Reactome, GO-Functions, GO-Processes and GO-Compartments. A p-value exceeding 1 after correction for multiple testing was considered as not significant (n.s.).
The user can download the proteins associated to a biological term.
By poiting the cursor into a chemical name, the 2D chemical structure is depicted as well as synonymous name and SMILES code. Clicking on the chemical name, the user is redirected to the PubChem database. By clicking on the protein name, more information about the protein function is described
An example with bisphenol A is depicted below.
The user can use this function with a protein search. In this case, the output will show pairs of chemicals that share the same set of proteins including the input protein.
-
Protein-protein interactions
The user has to select the protein of interest in "Please select the desired protein from the list:" otherwise the first protein (alphabetically) involved in a PPI is depicted in the visualisation applet. Proteins Enrichment to a biological terms is then computed and sorted by p-value as described in the previous section. Finally, the user can also download the proteins associated to a biological term
By clicking on a protein node, the user is redirected to the GeneCards server where extra information about the protein is described.
By poiting the cursor into a biological term, proteins associated to this term will be automatically depicted in red into the biological network.
An example with PGR (a protein suggested to be perturbed by bisphenol A) is depicted below.

-
Protein-protein associations network
With PPAN, we assume that two proteins are connected each other if they are affected by one compound. Globally, the higher is the number of compounds linked to two proteins, the stronger is the association between these two proteins. At the difference of PPI, PPAN is dependent of the number of compounds and bioactivities related to them and so it can result to a very large network. Therefore, only the 50 proteins with the highest probability score can be visualized in the applet. However, the full network is downloadable and the enriched annotation related to the biological terms enrichment are similar to those described previously.
-
Topological protein clustering