Output format
If the Potential > Threshold then O-glycosylation is predicted at that
site. Predicted sites are assigned 'G'.
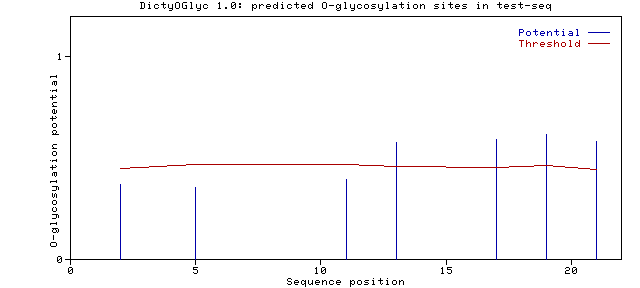
In this example Thr 13, 17, 19 and 21 are predicted to be O-glycosylated.
The higher the potential the higher is the confidence of the prediction.
The Threshold takes into account surface/buried predictions
of the particular site, and indicates
a value above which sites are predicted to be on the surface
and O-glycosylated.
The figure (using: Generate graph) shows the potential and threshold
versus sequence position.
Alternative non-predicted sites may be found where the potential is
high (>0.4) and threshold low (<0.55).
Name:  test_seq         Length:  22

GSDWSGVCKITATPAPTVTPTV <-- Submitted sequence.

............G...G.G.G. <-- The assignments. G stands for predicted

                           GlcNAc O-glycosylation at site.


SeqName    Residue   Number  Potential Threshold   Assignment

test_seq     Ser     0002    0.3727     0.4493         .

test_seq     Ser     0005    0.3553     0.4687         .

test_seq     Thr     0011    0.3973     0.4687         .

test_seq     Thr     0013    0.5762     0.4606         G

test_seq     Thr     0017    0.5945     0.4567         G

test_seq     Thr     0019    0.6180     0.4638         G

test_seq     Thr     0021    0.5827     0.4455         G

Graphics in
PostScript
