Output format
The DeepLoc 2.0 output is composed of three main components:
- The Predicted localizations and Predicted signals display the subcellular localizations and sorting signals predicted for the query protein, respectively.
- The Probability table displays the probability assigned by the model to each of the subcellular localizations. Localizations with a probability above the threshold are highlighted in green. The green intensity reflects the proximity of the localization probability to the threshold. The intensity increases the farther the probability is from the threshold.
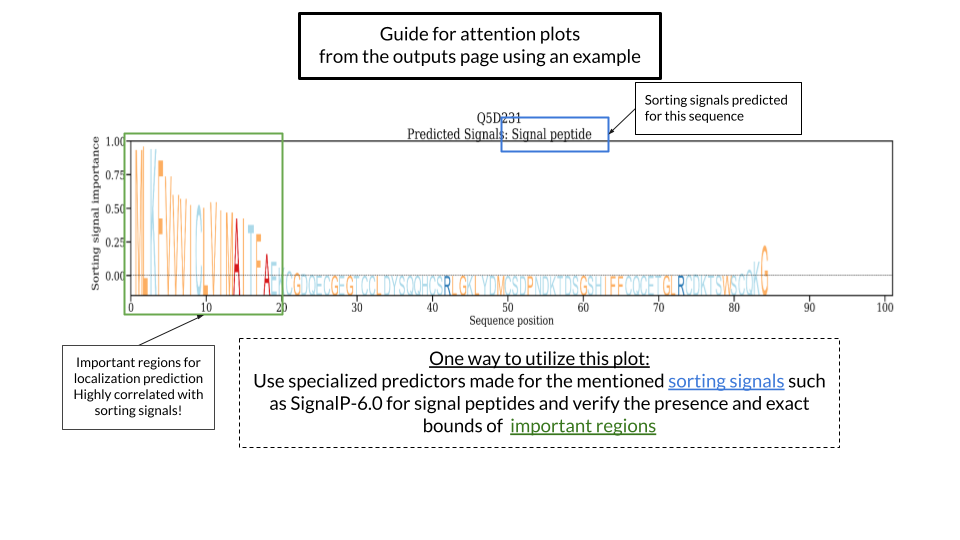
- The Sorting signal importance displays a logo-like plot of the positions in the query protein with higher importance for the prediction and highly associated with sorting signals.