DTU Health Tech
Department of Health Technology
This link is for the general contact of the DTU Health Tech institute.
If you need help with the bioinformatics programs, see the "Getting Help" section below the program.
DTU Health Tech
Department of Health Technology
This link is for the general contact of the DTU Health Tech institute.
If you need help with the bioinformatics programs, see the "Getting Help" section below the program.
The NetGene2-2.42 server is a service producing neural network predictions of splice sites in human, C. elegans and A. thaliana DNA.
Sequence submission: paste a single sequence or upload a local file
Restrictions
At most 1 sequence not less than 200 and not more than 100,000 nucleotides.
The sequence identifier can only contain alphanumeric characters.
Confidentiality
The sequences are kept confidential and will be deleted after processing.
CITATIONS - PAPERS TO REFERENCE WHEN REPORTING RESULTS
S.M. Hebsgaard, P.G. Korning, N. Tolstrup, J. Engelbrecht, P. Rouze, S. Brunak: Splice site prediction in Arabidopsis thaliana DNA by combining local and global sequence information, Nucleic Acids Research, 1996, Vol. 24, No. 17, 3439-3452.
Brunak, S., Engelbrecht, J., and Knudsen, S.: Prediction of Human mRNA Donor and Acceptor Sites from the DNA Sequence, Journal of Molecular Biology, 1991, 220, 49-65.
>sequenceident
ACGACCGTGACGTGCAGTAGTGGACGATTAGCTGATGCTAGCGGCGATCGATCGTCAGT
GCAGCTGATTAGCGGCTAGCTGACTTACGCGCGGATCATTTCTAGCGTAGCTAGCTGAC
ACGTACGGCTATTATGCTACTTAGCTGACTTATTAGGCCTATATGCGATGCTATGCTAG
CGAGCAATCGCCTACAGTATGATTAGACTTTCGAGTCGATACTCGATGCTAGCTAGTGC
CGATCGATTCGATTCGATTCG
| Position: | The position of the splice site in your sequence given as first (donor), or last (acceptor) nucleotide in the intron. The numbering of the direct (+) strand proceeds from the 5' end to the 3' end. For the complement (-) strand the numbering is given in both directions. |
| Frame: | The predicted frame offset (1,2 or 3) of the acceptor/donor site. |
| Strand: | The sequence strand (direct or complement). | Confidence: | The level of confidence for the sites (relative to the cutoff used to find nearly all true sites). Sites found by using cutoff values for highly confident sites are marked by the symbol H. |
| exon^intron: | Gives 20 bases of sequence around the predicted site. |
| Branchpoint: | The predicted branchpoint for an acceptor site (for A. thaliana only) acceptor site and branchpoint site, as well as a window of around the predicted site (marked 'A'). |
Please observe that the lists contain predictions made by TWO detection levels for true sites, one level where around 50% of the true sites are detected with very few false positive, and another level where nearly all true sites are found, but with more false predictions as well. Sites indicated by (H) are highly confident, and represent very seldom a false positive prediction, while those comprising nearly all sites are not marked. The confindence values for the predictions can be compared within each type only. This means that confidence values not marked by (H) in some cases can be larger than those for the (H) marked sites.
The output from the prediction is displayed in the output page of the prediction server. The postscript files can be retrieved directly by Netscape by selecting one of the two references in the bottom of the prediction output. If your viewer is set up to handle postscript, it will display the graphs. Otherwise you can retrieve the compressed postscript files directly to your computer using Netscape.
The top part of the figure designated "Coding" is the activity of an ensemble of coding predicting networks, values close to 0.0 indicate intron region, while values close to 1.0 indicates exon. In the "Donor" panel the activity of the ensemble of the donor site predicting networks is shown as impulses. An impulse with a hight close to 1.0 indicates a strong A. thaliana donor site. A cyan impulse is a prediction that has been discarded during the refinement, and a magenta colored impulse is a prediction that has been changed by the rule based system. The variable threshold computed from the coding predicting ensemble output, is used to select donor and acceptor site predictions.
The predictions in a numerical form may be downloaded from the output page of the prediction server. They are useful for detailed analysis of a sequence. The file produced contains a line starting with the symbol `>' followed by the name and the length of the sequence. This is followed by twelve columns, with the following information given by column number below.
Artificial neural networks have been combined with a rule based system to predict intron splice sites in the dicot plant Arabidopsis thaliana. A two step prediction scheme, where a global prediction of the coding potential regulates a cutoff level for a local prediction of splice sites, is refined by rules based on splice site confidence values, prediction scores, coding context, and distances between potential splice sites. In this approach, the prediction of splice sites mutually affect each other in a non-local manner. The combined approach drastically reduces the large amount of false positive splice sites normally haunting splice site prediction. An analysis of the errors made by the networks in the first step of the method revealed a previously unknown feature, a frequent T-tract prolongation containing cryptic acceptor sites in the 5' end of exons. The method presented here has been compared to three other approaches, GeneFinder, GeneMark, and Grail. Overall the method presented here is an order of magnitude better. We show that the new method is able to find a donor site in the coding sequence for the jelly fish Green Fluorescent Protein, exactly at the position that was experimentally observed in thaliana transformants. Predictions for alternatively spliced genes are also presented, together with examples of genes from other dicots, monocots, and algae. The method has been made available through electronic mail ( NetPlantGene@cbs.dtu.dk), or the WWW at http://www.cbs.dtu.dk/NetPlantGene.html
Keywords: Arabidopsis thaliana; splice site prediction; splice site pairing; plant biotechnology; neural networks; rule based systems.
Artificial neural networks have been applied to the prediction of splice site location in human pre-mRNA. A joint prediction scheme where prediction of transition regions between introns and exons regulates a cutoff level for splice site assignment was able to predict splice site locations with confidence levels far better than previously reported in the literature. The problem of predicting donor and acceptor sites in human genes is hampered by the presence of numerous amounts of false positives - in the paper the distribution of these false splice sites is examined and linked to a possible scenario for the splicing mechanism in vivo. When the presented method detects 95% of the true donor and acceptor sites it makes less than 0.1% false donor site assignments and less than 0.4% false acceptor site assignments. For the large data set used in this study this means that on the average there are one and a half false donor sites per true donor site and six false acceptor sites per true acceptor site. With the joint assignment method more than a fifth of the true donor sites and around one fourth of the true acceptor sites could be detected without accompaniment of any false positive predictions. Highly confident splice sites could not be isolated with a widely used weight matrix method or by separate splice site networks. A complementary relation between the confidence levels of the coding/non-coding and the separate splice site networks was observed, with many weak splice sites having sharp transitions in the coding/non-coding signal and many stronger splice sites having more ill-defined transitions between coding and non-coding.
These graphs show the performance, by plotting the false positive % against the specificity %. The graphs are given for each species for both donor and acceptor site prediction.
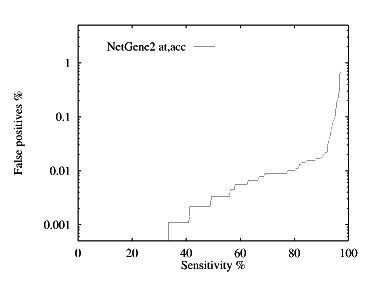
Acceptor site prediction performance
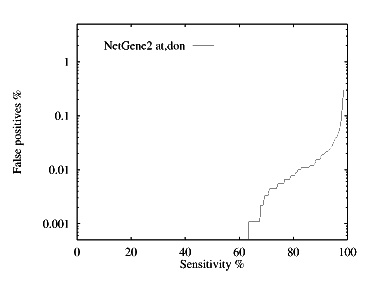
Donor site prediction performance
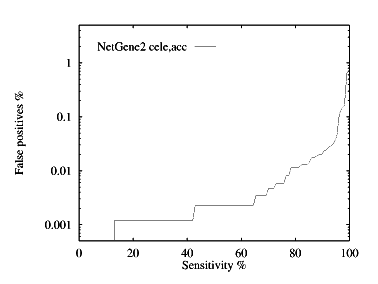
Acceptor site prediction performance
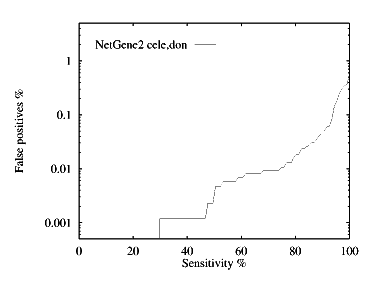
Donor site prediction performance
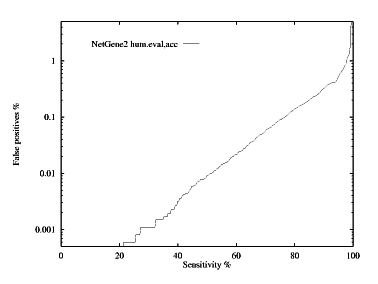
Acceptor site prediction performance
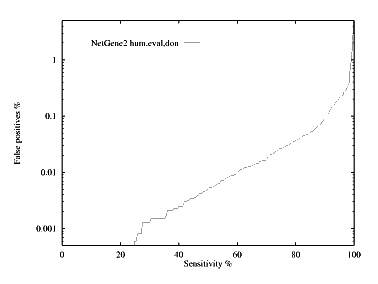
Donor site prediction performance
If you need help regarding technical issues (e.g. errors or missing results) contact Technical Support. Please include the name of the service and version (e.g. NetPhos-4.0) and the options you have selected. If the error occurs after the job has started running, please include the JOB ID (the long code that you see while the job is running).
If you have scientific questions (e.g. how the method works or how to interpret results), contact Correspondence.
Correspondence:
Technical Support: